
A Raspberry Pi Pico as a simple characteristic curve recorder
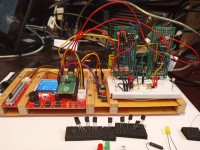
The development board and the circuit board with the potentiometer from the Raspberry Pi Pico Experimenting Kit from Elektor are excellent for such a small project, as I found out. Only a few additional circuits are needed on small PCBs, as I will show.
After I had dealt in detail with the program examples in the instruction book, where the display is used on the above-mentioned Develop Board, I first built the electronic circuits required for a characteristic curve representation on breadboards and designed the first version of a program suitable for my project in Micropython for the Raspberry Pi Pico. This makes the Pico a simple characteristic curve recorder for diodes, LEDs, npn and also pnp transistors, field-effect transistors and mosfets.
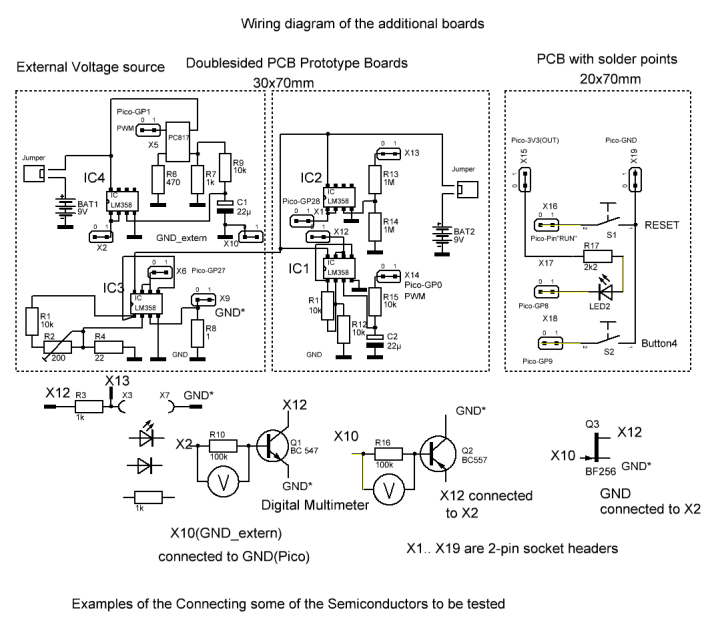
The characteristic curves are shown in color on the small display of the Development Board. For the sake of clarity, circuit details of the Development boards and those of the PCB with the potentiometer from the Raspberry Pi Pico Experimenting Kit from Elektor not shown in Figure 2. They can be found on the Makerfabs website. The program in Micropython generates a continuously changing PWM signal at Pico-GP0 starting from 0 V. This is pending at X14, is smoothed and passed to the non-inverting input of OP1 in IC1 (pin 1,2 and 3). With the help of R11 and R12, the DC voltage created in this way is doubled from 0 V to a maximum of approx. 3.3 V to approx. 6.6 V and OP2 is transferred to IC1 (pins 5, 6 and 7), which serves as a voltage follower.

The characteristic curves are shown in color on the small display of the Development Board. For the sake of clarity, circuit details of the Development boards and those of the PCB with the potentiometer from the Raspberry Pi Pico Experimenting Kit from Elektor not shown in Figure 2. They can be found on the Makerfabs website. The program in Micropython generates a continuously changing PWM signal at Pico-GP0 starting from 0 V. This is pending at X14, is smoothed and passed to the non-inverting input of OP1 in IC1 (pin 1,2 and 3). With the help of R11 and R12, the DC voltage created in this way is doubled from 0 V to a maximum of approx. 3.3 V to approx. 6.6 V and OP2 is transferred to IC1 (pins 5, 6 and 7), which serves as a voltage follower.
OP1(pins1,2 and 3) of IC2 serves as a voltage follower. The output voltage (Pin1) is connected to the ADC2 pin of the Pico (GP28). Its input voltage may not exceed 3.3 V. For this reason, a voltage divider consisting of R13 and R14, consisting of two resistors of 1 megaohm each, is connected to the non-inverting input of OP1. The measurement of the current during the characteristic curve recording of diodes, transistors, etc. is done here by the respective pin of the semiconductor to be examined not directly connected to GND, but to X9 GND*. The low current in R8 is measured indirectly using OP1 (pins 1,2 and 3) in IC3 by offering the small voltage drop at R8 to the non-inverting input and increasing it to a hundredfold using R1, R2 and R4 in OP1. The output of OP1 is connected to OP2 in IC3, which serves as a voltage follower.
1 milliampere in R8 becomes 0.1 V, or 10 milliamperes become 1 V in OP1 of IC3. For the exact setting, connect a resistor of 1k between X13 and GND* and use a digital multimeter to measure the voltage applied to it at the end of the program when running the program in Micropython. According to Ohm's law, the voltage value corresponds to the current value in milliamperes. The voltage gauge between the output of OP2 in IC3 and GND is connected to it and the voltage is set there with the help of the trim potentiometer R2 according to the current previously measured indirectly at the resistance of 1k, for example at 3 milliamperes the voltage at pins 6 and 7 of IC3 is 0.3 V. These pins are connected to ADC1, Pico-GP27. The measurement of the current in the component to be examined, in this case a resistance, is measured indirectly with the help of ADC1 of the microcontroller.
The circuit around IC4 is similar to that around IC1. The Micropython program measures the voltage at the potentiometer at ADC0(Pico-GP26) and generates a PWM signal at Pico-GP1 accordingly. This is fed to a PC817 optocoupler. Its output signal is smoothed and offered to the non-inverting input of OP1 in IC4 (pins1,2 and 3), which serves as a voltage follower. At the output of OP1 (Pin1, X2), an adjustable DC voltage is available using the potentiometer from the Raspberry Pi Pico Experimenting Kit. IC4 is supplied with its own voltage source, so that the circuits presented here can also be used to calculate current-voltage characteristics of pnp transistors, field-effect transistors, etc. can be recorded and displayed.
On the third small circuit board there is a micro button, which serves as a reset button for the microcontroller, another Micro button connected to Pico-PG9, as well as a red light-emitting diode with a resistor, which are connected to Pico-PG8. With this micro sensor, another button is available for the project for a selection of another, here the red color of the current-voltage characteristic curve to be displayed, which is indicated during recording with the help of the red light-emitting diode.
Figure 2 also shows how to connect a diode, an LED or a resistor to be tested for characteristic curve recording. If an npn transistor is connected for examination, its base must be connected to X2 in the case of a current control via a series resistor of 100 k. In a voltage control, the base of the npn type is directly connected to X2. The collector of the transistor is connected to X12 and its emitter to GND*. GND is also connected to GND_extern. Because of the extremely low base current, instead of the collector current, the emitter current = collector current + base current is indirectly measured. The base current is measured indirectly with the help of a digital multimeter parallel to the 100k resistor during the characteristic curve recording when the transistor is currently controlled.
The setting of the same is done in the Micropython program by reading the voltage at the grinder of the potentiometer and then converting it into a corresponding value of the PWM signal at pin Pico-GP1 and using the circuits around IC4 into a corresponding adjustable DC voltage. In order to record the characteristics of a pnp transistor such as a BC557B in current control, its base is connected to X10(GND_extern) via a resistor of 100k. The emitter of the pnp type is connected to X12 and to X2 (output from OP1 to IC4). The collector of the transistor must be connected to GND*. With such a transistor, the collector current is measured indirectly. The base current is measured indirectly in a current control as in an npn type using the voltage drop at the 100k resistor.
When recording the output characteristics of the pnp transistor in voltage control, X10 must be connected directly to the base of the transistor, whereby a digital multimeter measures the currently set base-emitter voltage.
The display area of the small display on the Develop Board is 128x128 pixels. For this reason, two 9V batteries or rechargeable batteries with the same output voltage are sufficient as sources of operation for the circuits presented above. For this reason, the display range of the voltage is limited to 6V. The current display range is a maximum of 10 milliamps.
Summary, outlook: On the display of the Raspberry Pi Pico Experimenting Kit, after adding only three small printed circuit boards with a few components, current-voltage characteristic curves of semiconductors can be displayed as colored lines with the help of a program in Micropython. Due to the small display in the Raspberry Pi Pico Experimenting Kit of 128x128 pixels, two 9V batteries or two rechargeable batteries with the same output voltage serve as power supplies in the project. When displaying current-voltage characteristics, their display range is limited to a maximum of 6 V and a maximum of 10 milliamperes. This should be enough for the hobby sector.
Summary, outlook: On the display of the Raspberry Pi Pico Experimenting Kit, after adding only three small printed circuit boards with a few components, current-voltage characteristic curves of semiconductors can be displayed as colored lines with the help of a program in Micropython. Due to the small display in the Raspberry Pi Pico Experimenting Kit of 128x128 pixels, two 9V batteries or two rechargeable batteries with the same output voltage serve as power supplies in the project. When displaying current-voltage characteristics, their display range is limited to a maximum of 6 V and a maximum of 10 milliamperes. This should be enough for the hobby sector.
The use of a color display, for example with 240x320 pixels, would allow for a larger representation of the grid on the display with horizontal and vertical lines.
With a voltage source of 12 V, the display range for the voltage values could be increased to 10 V and that for the current to 20 or 40 mA. In addition, more current and voltage values could be displayed in color in the free area of the display for the relevant current-voltage characteristic curves.
Update of my project
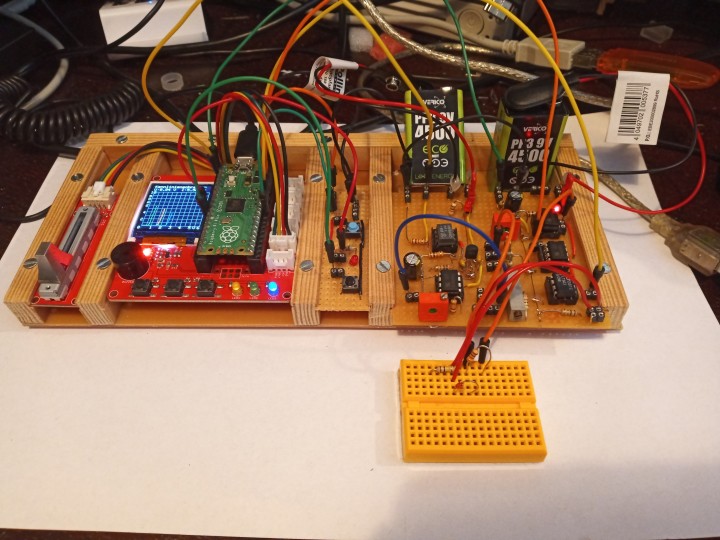
I have the circuits of the first version of my project on two prototype boards, meanwhile housed on a board of the size 70mmx80mm with solder dots. The following changes have resulted:
On IC1, the fixed resistor of 10 kiloohms, which is connected to GND, has been replaced by a trim resistance of 10 kiloohms. With a voltage supply of 12 to 13.5 V, the output voltage of the second operational amplifier in IC1 at terminal X12 can be adjusted to a voltage of up to 10 V, for example, with the help of a voltmeter. The electrolytic capacitor for smoothing was replaced by a 100 microfarad specimen. The resistors of 1 megaohm at the input of op-amp 1 in IC2 have been replaced by two other resistors of the same value.
This means that the program can also be used to measure voltage values larger than 5 volts in Micropython and to visualize them on the display of the Makerfabs development board. The circuit at pins 1 and 2 of the operation amplifier 1 has been changed to IC3 to achieve a wider output voltage adjustment range. The optocoupler is now supplied with 5V using IC6. The fixed resistor and trim potentiometer on pins 1 and 2 of IC4 ensure that the output voltage of IC4 can be adjusted with a screwdriver using a voltmeter, For IC3, an LT1413 has now been provided instead of an LM358, as this IC only has a maximum input offset voltage of 280μV according to the data sheets compared to the LM358 with an input offset voltage of 3 mV.
The design for the construction of the circuits on the above-mentioned circuit board was carried out with the help of the software Lochmaster4.0 from www.abacom-online. The file created with this can be found within the ZIP file, as well as JPG files and BMP files of the circuits on the above-mentioned PCB with solder dots, as well as a bill of materials of the components used.
These are my suggestions for the step-by-step construction of the circuits on the 70x80mm PCB with solder points, for example with the help of the pictures of Lochmaster4.0 and with the help of sPlan8.0 of www.abacom-online.de circuit diagram next to it:
Solder the left half with the jumper, the red light-emitting diode with resistor to the voltage regulator IC6 with the 100nF capacitors. Then use a digital multimeter in the resistor area to check the previous work for soldering errors and connect a 9V source to the terminals GND ext. And +9V ext.connect. Use the voltmeter to check whether 5 V can be measured against GND ext. at pin A of IC6. Then disconnect the 9V battery again. Now solder in the IC sockets for IC5 and IC4 and solder the parts around the socket for IC4. Then use the multimeter in the 20Kiloohm resistance range to check that the 10Kiloohm resistor and the 10Kiloohm trimmer are correctly connected according to the wiring diagram. Then check whether the line from pin 8 of the IC4 to the voltage regulator has been connected correctly.
Please note: The piece of wire between pin 1 and pin 5 of IC4 is soldered on the solder side of the PCB. Likewise, the 100nF capacitor between pin 8 and pin 4 of the IC is also soldered on the solder side of the PCB. Geanauso is at IC1... IC3. If no soldering errors have been made, IC4 can be plugged into the IC socket, and the 9V voltage source can be connected.
If all sub-steps have been carried out correctly, a voltage of about 9 V against GND externally can be measured at pin 8 of IC4 alone. After disconnecting the 9V battery, then solder the socket for IC5 and the components belonging to it. Even before the 9V voltage is applied again, the partial work can be checked with the help of a multimeter in the resistance range and, if necessary, the error can be corrected before connecting the 9V voltage source. The IC socket for IC1 and the circuits around it are similar to those around IC4. After soldering on the IC socket and the other components, the subcircuit must be checked for soldering errors with the help of a multimeter in the resistance range. Similar to the suggested above, a digital multimeter in the 20 kiloohm resistance range can be used to check whether the trim potentiometer has been connected correctly.
The light-emitting diode with its 10 kiloohm series resistor is used, like D1, to indicate the readiness for operation. On top of it are the IC socket for IC2 and the components to solder it. After checking these designs with the help of a multimeter in the resistor range, the IC socket for IC3 and the components around it can be soldered on. The correct function of the trim potentiometer can be checked with the help of a digital multimeter in the resistance range of 100 kiloohms, similar to the one above. Once all socket headers have been soldered on, a 9V voltage source can be connected to power these subcircuits after re-checking the right part of the circuits on the 70x80mm PCB with solder points. The red light-emitting diode at the top of the right side of the PCB should light up when the jumper has been plugged in to turn it on. At IC1, IC2 and IC3, a voltage of 9V should be measured between pin 8 and GND.
Now the components IC1.. IC5 into the IC sockets provided for this purpose can be plugged in. Subsequently, the functioning of the circuits can be checked in interaction with the Raspberry Pi Pico. If all the points specified in the schematic have been connected to the respective pins of the Raspberry Pi Pico on the development board with flexible insulated lines and also also the components with the two micro buttons (RESET, Button4) and the red light-emitting diode with a series resistor, the potentiometer from the kit is connected.
Please note the following: The connecting cables to the analog inputs GP27 and GP28 are not connected to the Pico at first, so as not to overload these inputs of the microcontroller with too high voltages due to the currently available settings on the trim potentiometer on the 70x80mm PCB, which is now supplied with two batteries of 9V each.
For a first test, the program I developed can now be loaded in MicroPon in the Thonny development interface. For example, for the settings of the trim potentiometers on the 70x80mm conductor plate with solder points to be made before a characteristic curve recording, the line ch0.duty_u16() must first be commented on at the end of the function red_curve, i.e. it becomes #ch0.duty_u16(), so that the output voltage U_out1, which is measured with a digital multimeter, rises from 0 volts to a certain value after starting the program and then pressing Button4 and does not immediately afterwards, as happens later with a characteristic curve recording, becomes back to 0 volts.
If the grinder of the potentiometer is moved in the kit, after correctly connecting the pins of the Pico to the already soldered components and plugged in the two IC 4 and IC5 on the 70x80 mm circuit board with solder points between the pins U_out2 and GND_extern, an adjustable voltage can be measured with the help of a voltmeter. This can also be changed in size with the 10kiloohm trim resistor by IC4.
If Button4 is pressed, a DC voltage changing from 0 V to be measured between pin U_out(X12) and GND. Their size can be changed using the trim potentiometer. If only a 9V battery is used for the power supply, the maximum voltage can be set to about 6.5 V with a blade turner on the trim pot. If a 9V battery and a 3V battery or a 4.5V battery are connected in series, the output voltage could U_out be set to 10V. If pin U_out is connected to pin X5 using an isolated wire, half of the voltage of U_out can now be measured on pin 1 of IC2 in previously error-free soldering. If pin U_out connected to X4, about a quarter of the voltage of U_out can be measured at pin 1 of IC2.
Now a light-emitting diode is connected via a series resistor of 1 kiloohm between pin U_out and GND*. If the soldering work on the right side of the board has been carried out correctly, the LED lights up. The voltage drop at your resistor of 1 kiloohm divided by the resistance value corresponds to the current through the resistor and through the light-emitting diode. This voltage is to be measured with the voltmeter. If you then measure with a voltmeter between the pin Pico/GP27 at pins 6 and 7 of IC3, this voltage should correspond to a hundred times the previously indirectly measured current in the 1Kiloohm resistor and in the light-emitting diode, i.e. at 1 milliampere this is for example 0.1 V, at 5 milliamperes 0.5 V. This value can be set with the help of a screwdriver on the trim potentiometer near IC3.
After connecting X13 to the anode of the light-emitting diode, from its cathode to GND*, connecting the free pin of the resistor in front of the LED to U_out1 and connecting the two analog inputs of the Raspberry Pi Pico GP27 and GP28 with the corresponding pins on the PCB with solder points, the program is started again in MicroPython. Now on the small display of the development board first a grid with horizontal and vertical lines and with labels on the left side and bottom and then, after pressing Button4, the relationship between current and voltage of the connected light-emitting diode should be shown as a red characteristic curve. In a similar way, light-emitting diodes of a different color can be connected and their characteristic curves can be shown in color on the small display.
In addition to the coloured characteristic curve of the light-emitting diode in question, the voltage value at the end of the characteristic curve recording and the corresponding value of the current are displayed at the top of the display.
Please note the following:
In principle, it is possible to extend the measuring ranges in the characteristic curve display for voltage and current values if you proceed carefully so as not to overload the analog inputs of the microcontroller under any circumstances.
First, the connecting cables from the 70x80mm PCB to the two analog inputs ADC1 and ADC2 of the Raspberry pi Pico have to be interrupted. To display the voltage at 10 volts, change the corresponding designations 0.1, 2, 3, 4, 5, V, 6 to 0, 2, 4, 6, 8, 10 V 12 in function KennL_start in the program. In order not to overload the input ADC1 (pin GP28) of the Pico, X14 is now responsible for the voltage measurement instead of terminal X13! To do this, start the program in MicroPython and press Button4. If U_out1 is connected to X14, a quarter of the voltage between X1 and GND can be measured U_out1.
If the range of representation for the current is extended to 20 mA, the designations 2, 4, 6, 8, 10 mA in the above-mentioned function are to be changed accordingly to 4, 8, 12, 16 20 mA. In this case, if a light-emitting diode is connected between U_out1 and GND* via a series resistor of 1 kiloohm, the voltage must be measured at this resistor. With Ohm's law, the current in the resistor and in the light-emitting diode can be determined. The amount of voltage to be measured between X6 and GND should be one hundred times the previously indirectly determined current in the resistor and in the light-emitting diode. Now use the trim potentiometer on IC3 to set the output voltage with a screwdriver under the control of a voltmeter so that the voltage between X6 and GND has half of the just measured value.
Now the MicroPython program can be terminated and, after connecting the previously separated two lines from the 70x80mm PCB to the analog inputs ADC1 and ADC2 of the Raspberry Pi Pico, it can be started again to record characteristic curves of semiconductors.
The IC1 (LM358) used in the project can handle output currents of up to 20 milliamperes, according to the manufacturer's data sheets. For example, you can use the output signal from OP2 in IC1 to control an L272 power operational amplifier. According to a manufacturer's data sheets, this can allow much larger output currents to flow. In this case, I think it makes sense to use a power supply with stable 12V DC voltage instead of a power supply of 9V or 9V plus 3V with batteries.
I enjoy experimenting with electronics and programming microcontrollers. These include a Rasberry Pi Pico, which can be programmed in MicroPython with the help of Thonny. The project I presented with the development board with the small colored display and the slide potentiometer from Makerfabs, which is included in a bundle from Elektor, and the two additional boards can show what other uses there are for the Pico. It was created for the joy of doing and is not perfect. The program in MicroPython can also be improved. I would be happy if I can encourage other readers to get involved with the Raspberry Pi Pico with my contribution.
Build This Project
Bring this design to life with the Elektor PCB Service, powered by Eurocircuits. Upload the project files and order professionally manufactured PCBs or assembled boards through a proven European production platform.
Supporting KiCad, Eagle, Gerber, and ODB++ formats, the service is suitable for everything from prototypes and validation builds to series production and volume manufacturing.
Made in Europe. Fast. Reliable. Professional.
Updates from the author