
Aftermath Of US Shale Gas - Oil index Or Decoupling?
on
Aftermath Of US Shale Gas - Oil index Or Decoupling?
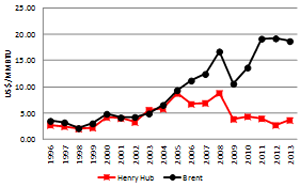
Liquefaction of natural gas requires huge capital upfront investment; therefore LNG producers in an effort to protect investment and to satisfy their bankers enter into long term sale purchase agreements. In the absence of developed natural gas markets, the pricing mechanism more or less directly links with agreed crude oil prices. Therefore, LNG prices in various markets tend to directly or indirectly correlate with the oil prices with some lags.
 |
 |
| Figure 1: Historical relationship of natural gas and crude oil prices Source: BP Statistical Review of World Energy June 2014 |
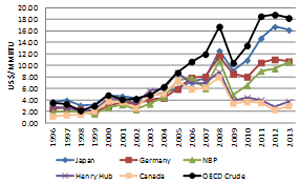
Up until 2007, LNG prices in all the markets were closely associated though with different magnitude and lags. This situation changed after oil price shock of 2008 when oil prices peaked to a record level of $147/bbl in July and then collapsed in December to below $40/bbl. Since around the middle of 2009 oil prices recovered strongly (on an average remained above$70/bbl during June 2009/Feb 2011, thereafter above $100/bbl). The prolonged period of higher oil prices finally dwindled in late 2014 and down to below $50/bbl in January 2015. LNG prices other than those in the US and Canada continue to correlate with oil prices but the historical relationship has surely weakened and vary from market to market.
In North America for example, the historical relationship not only weakened but de-coupled with the crude oil prices due to significant increase in US shale gas. In Canada, prices were also tracking a similar weaker link as US reduced its gas imports from Canada that resulted in surplus gas. In contrast to North America, the oil based relationship in Europe remained intact though somewhat weakened [note 1]. Historically, Europe LNG prices remained between Asian and North American markets for the reason of multiple options at their disposal. Excellent pipeline infrastructure, regional gas production, flexibility of importing natural gas-pipe gas from Russia and Algeria and greater flexibility of LNG imports. However, unlike North America, UK and Europe LNG price differentials widened as the new LNG supplies meant for the US market found its new home in Europe, but the oil relationship remains intact. Europe and UK were absorbing bulk of new LNG supplies but economic slow down has waned natural gas demand. The weaker demand in Europe, also allowed some European countries to re-export to Asian markets - cargo diversion from West of Suez to East of Suez became a norm.
In contrast, Asian markets remained tight due to the increase of demand for LNG in India and China in addition to traditional markets of Japan, South Korea and Taiwan. The Asian LNG market further tightened as a result of 2011 tragic Fukushima disaster in Japan. Historically, 30% of Japanese electricity generation was associated with nuclear and 27% accounted by LNG. In 2011, all the 54 nuclear plants were shut down.
| Asian markets remained tight due to the increase of demand for LNG in India and China |
From the buyer’s perspectives, the pricing issue is dependent on individual country’s energy policies – as to what energy mix they like to have, which depends on country’s endowment and economic situation. For example, if Japan decides to reopen all its nuclear plants then it may ease their LNG import requirements and to some extent ease its import bills. Since the disaster of 2011 until recently Japanese buyers are paying higher LNG prices to substitute the shortfall of nuclear energy. To counter this high import dependency and avail some flexibility in supplies, Asian major players are investing in the US, Canada, Australia, and other resource rich countries to enhance flexibility in supplies and prices. Our assessment is that with the expiration of existing contracts, the quantity will be substituted with new supplies coming from Australia, USA, Canada and other new LNG suppliers. Though the recent collapsing of oil prices provided some relief to LNG importers, the LNG prices did not dwindle in a ratio of one-to-one as protected by S-Curve pricing mechanism and further some benefits were lost due to a stronger US dollar. As a result, contracted prices did not decline substantially, however, spot prices were down and in some cases were traded around $10/MMBTU as compared to $22/MMBTU during period of tight market. This is due to softer LNG demand and availability of more uncontracted quantity in the market [note 3].
Global LNG capacity and Outlook
Figure-2 illustrates LNG capacities as of Feb 2015. During the last forty-five odd years global LNG capacity has gradually increased, however, acceleration was witnessed during the last decade. As a result, global LNG capacity increased to 314 MTPA. Presently twenty countries are LNG producers compared to 22 LNG importers [note 4].
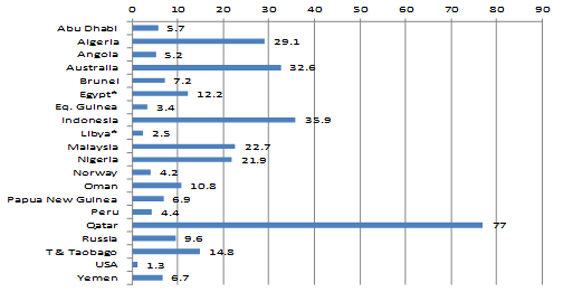 |
| Figure 2: LNG existing capacities – by countries (MTPA) Feb 2015 - Source LNG Journal Feb 2015 |
At the end of 2013, out of total global natural gas consumption of 3347 BCM, about 69% is domestically consumed while 31% is traded as pipe gas (21.2%) and LNG (9.7%). Japan, the largest LNG consumer accounting for about 37%, South Korea (17%) and China (8%) are the dominant LNG consumers. As far as regional LNG import is concerned, Asia accounted for 73%, Europe 16%, C&S America 6%, North America 4% and Middle East the remaining 1%. Natural gas consumption in the Middle East is expected to increase rapidly in the years to come due to rapid regional economic growth and environmental related issues. Regional pipelines from Qatar to other GCC and other neighboring countries probably allows them to substitute oil based power generation with more benign natural gas.
The last forty-five years saw the global LNG capacity increase to 314 MTPA, however, in the next just 10 years or so additional LNG capacity of 450 MTPA is expected to be added. (see Table 1). How will this new LNG supplies coming from multiple sources, particularly from US, Australia and Canada affect the oil-indexed relationship? Well, US LNG is expected to penetrate the global market, however, British Colombia LNG shall end up in Europe taking advantage of the shorter distance. Australia and East African countries on the other hand are expected to target the Asian market. The question is how new LNG supplies from these countries will likely influence the LNG pricing mechanism. Does it mean that LNG prices will significantly soften and decouple from crude oil? In our personal view the answer is no. The reason is that most of the Australian and East African LNG projects are quite expensive, and especially Final Investment Decision (FID) for Australian supplies already are locked-in based on oil-index basis. A similar pricing mechanism is expected to be followed by new East African LNG producers. In contrast, US and Canadian LNG pricing mechanisms will be based on Henry-Hub plus. The bulk of cheaper shale gas definitely provides a leading edge to US to effectively compete in any market in the world. At the same time more LNG supplies will promote the development of much needed spot markets and allows the buyers/sellers to enter into new sorts of flexible partnership. Due to having only a few sellers in the past, contracts were signed on long-term basis bounded by clauses of take or pay in order to lock higher percent of Annual Contracted Quantity (ACQ) 80% (it could vary from contract to contract). The future contract may call for reducing this binding ACQ. That will allow more LNG to be available for trading in spot markets providing some room of flexibility to both buyers and sellers. The combination of oil-indexed supplies, Henry Hub linked supplies from the USA, or from other sources will allow the buyers to address security of supply related issues and reduce Asian buyer’s average imported prices.
Table 1: New LNG Export Projects
Source: LNG Journal February 2015
| Countries | Expected Time | Capacity (MTPA) |
| Australia | 2015-2018+ | 70* |
| Canada | 2017-2020+ | 108 |
| Indonesia | 2015-2016 | 6.5 |
| Malaysia | 2015-2016 | 6.3 |
| Mozambique | 2018-2020+ | 22.5 |
| Nigeria | 2016+ | 38.4 |
| Russia | 2017-2019+ | 46.5 |
| USA | 2016-2020+ | 152 |
| Total | 2013-2018 | 450.6 |
*Including APLNG and Gladstone CSG to LNG 15.6 will be completed in 2015
In all fairness, despite expected significant increase in LNG and natural gas supplies, our opinion is that historical relationship between crude oil and LNG prices will remain intact though on a weaker mode and with some modifications of sliding scale for mutual benefits. The reason being that new LNG projects are expensive; banks and sponsors ensure long-term contracts with some linkage to crude oil prices in order to protect their financing. However, we expect some rationalization of price ranges and respective discounts (sliding scale bounded by various price ranges) to avoid paying exaggerated prices by the buyers and also protect the interest of sellers. In addition, new long-term contracts may also look for reduction in minimum ACQ. This will provide some flexibility to both the parties to maneuver their balance quantity to buy/sell to their advantage. This may help both the sellers and buyers to maintain a long-term mutually beneficial relationship should the oil prices collapse or further increase to over $120/bbl. We think the supplies from USA, Canada and Africa will facilitate the speedy process of price rationalization without breaking the historical oil-index relationship. In addition, the major LNG consumers in Asia are already in the process of supplies diversification. Investment in supply chains in the USA, Canada, and Australia will allow them to lower their security of supplies premium to avoid a repetition of the past.
| Dr. Ghouri is Senior Performance Analyst in Finance and Planning directorate. The views, findings, interpretations, and conclusions expressed in this paper do not necessarily reflect the views of Qatar Petroleum. Umama Ghouri is an MBA Student at University of Texas, Arlington. |
- Natural gas pricing formulas in Europe are generally based on industrial buyer markets, where natural gas competes with heavy fuel oil, gas oil, and low/high sulphur oil.
- GDF-Suez, the French utility and liquefied natural gas and energy player, earnings before tax and depreciation for 2014 from its global gas and LNG business rose almost 11 percent last year to 2.2 billion euros ($2.5Bln) because of strong LNG activity in Europe and Asia, partially offset by the fall in prices in the exploration-production division because of oil price falls (as reported in LNG Journal).
- Despite oil price down below $60/bbl Japanese buyers are still paying around $15/MMBTU based on long-term contract.
- Libya’s LNG is out while Egypt’s LNG plants are operating at less than 50% capacity due to feedstock issues.
Discussion (0 comments)