
Review: Walabot Creator - an extraordinary 3D-sensor
on

Walabot is a 3D-sensor that uses high-frequency radio waves to draw a 3D “image” of whatever appears in front of it. It is not (easily) thwarted by walls or other obstacles while doing this. But that is not all: the developers have managed to cram in other functions as well, such as a breathing monitor and a tracking function.
Unpacking and setting up
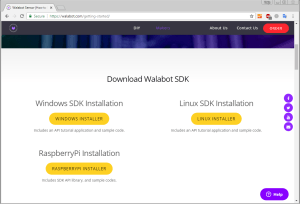
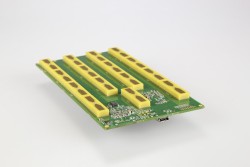
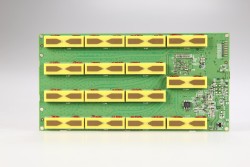
We start from the beginning. We have the Walabot Creator in front of us. In the packaging we find a concise leaflet with Get Started instructions and the Walabot Creator itself. A brief glance at the leaflet directs us to the website https://walabot.com/gettingstarted, where you can find a Walabot API tutorial and from which you can also download the free Software Development Kit (SDK). The SDK is available for Windows, Linux and Raspberry Pi (as a .deb file). While there exists an Android app with the name “Walabot DIY”, it unfortunately only works with the Walabot DIY and not with the Starter, Creator or Developer.

We used the Windows version and installed it on a Windows 7 Professional 64-bit system. During the installation Windows asks whether to trust the driver for the Walabot, which you have to answer in the affirmative, of course. The first attempt at installing the software on a Windows 10 machine appeared initially to be successful, but unfortunately the Wallabot was not detected when it was hooked up. Fortunately, there is also a “Windows 10 SDK beta” and that worked fine.
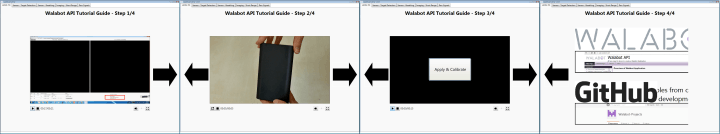
Once installed, the Walabot application is started via the link “WalabotAPItutorial” that the installation program created in the start menu. The program initially shows the tutorial for connecting up the hardware, which comprises four steps. After that you can use the tabs at the top of the screen to switch between the various options that the SDK has to offer.
What does it look like?
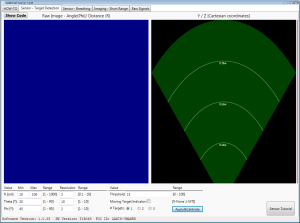
The page behind the second tab of the program — Sensor – Target Detection — is actually the most interesting part, because here you can set the various parameters and receive visual feedback of what the sensor 'sees'. When it comes to the settings, the following parameters can be changed:
- R sets the sensor range from 1 to 1000 cm*
- Theta sets the horizontal angle of the sensor range from 0 to 90 degrees**
- Phi sets the vertical angle of the sensor range from 1 to 90 degrees**
- In the column Resolution you set the resolving power of each of the three aforementioned parameters
- Using the Threshold setting you filter out weak signals
- When you tick the Moving Target Indicator the software will only show moving objects; objects that moved but then become stationary will be slowly filtered out.
- With the number of targets you indicate how many moving objects the software can expect and the maximum number that should be displayed in the detection fields
** Walabot 'upright’ with the USB connection pointing downwards.
Furthermore, we find two buttons: ‘Apply & Calibrate’ and ‘Sensor Tutorial’, which really speak for themselves. To apply a change in parameters you click the button Apply & Calibrate. This then also calibrates the sensor. Note that when calibrating it is important that there are no moving objects in front of the sensor. This will disturb the calibration process and will lead to incorrect measurements.
Arena
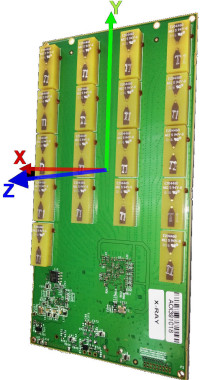
The two large windows give a visual indication of what the antennas of the Walabot pick up. The area that the sensor scans is called the ‘Arena’. These two windows are therefore a visual interpretation if this arena. Both display the y and z measuring range, this is where the sensor is the most sensitive. The most sensible orientation of the sensor is therefore ‘horizontal’, with the USB connector in the right when looking towards the antenna array of the Walabot. This way a movement of a detected object towards the left corresponds to what you see on the screen.
The window on the left indicates the intensity of the measured signals (reflections), light blue for the lowest intensity, red for the highest intensity. The position on the screen corresponds, as already mentioned, to the position in the Arena.
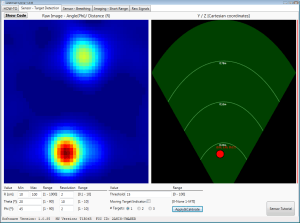
The window on the right shows a Cartesian view of the yz surface (actually the xz surface when the sensor is positioned horizontally, as we suggested above). The selected sensing angle (phi) limits the 'view' of the sensor and gives the 'Arena' the shape of an upside-down cone. Note that not every combination of sensor angles phi and theta are possible. The software will then give an error message. In this 'graph' the software shows (up to a maximum of three) objects that the sensor detects with a red dot accompanied by numerical data. Call it a filtered version of the left window, supplemented with exact numbers.

Discussion (2 comments)