
USB Long-Term Weather Logger (100888)
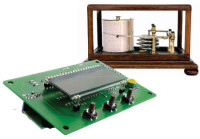
This stand-alone data logger displays pressure, temperature and humidity readings generated by I²C-bus sensors on an LCD panel, and can run for six to eight weeks on three AA batteries. The stored readings can be read out over USB and plotted on a PC using gnuplot.
This stand-alone data logger displays pressure, temperature and humidity readings generated by I²C-bus sensors on an LCD panel, and can run for six to eight weeks on three AA batteries. The stored readings can be read out over USB and plotted on a PC using gnuplot. Digital sensor modules keep the hardware simple and no calibration is required.
Published in issue 417, September 2011
Main PCB, bare, 100888-1
ATmega88-20PU, programmed, 100888-41
HH10D humidity sensor module, 100888-71
HP03SA air pressure sensor module, 100888-72
Kit incl. PCB, controller, humidity sensor and air pressure sensor modules, 100888-73
By Wilfried Wätzig
This data logger was designed as a long-term recording system for pressure, temperature and humidity data. Samples are taken at regular intervals and stored in a serial EEPROM, which means that they are preserved even when power is lost. A serial-to-USB module allows the data to be read out by a connected PC for processing. The sensor modules (one for pressure and temperature, one for humidity) with I²C interfaces are supplied ready-calibrated, which simplifies construction and processing considerably. Thanks to its LCD panel and (rechargeable) battery power supply the logger can be installed anywhere for stand-alone operation. The use of a power-efficient ATmega88 microcontroller keeps the average current draw of the circuit below 2 mA.
The firmware is written in C and compiled using AVR-GCC. The source code is available for download, so that it can be modified to work with other types of I²C sensor if necessary.
Hardware
Since modules are used for some of the functional blocks, the circuit is simple and clear. At the heart of the circuit is the ATmega88 controller (IC2), which is connected to the various modules. Two of these are connected in the usual fashion to port pins.
- The DOGM162 display (LCD1) [3] is a two-line by sixteen-character unit without backlight. The display is driven in four-bit mode over PORTB. It was chosen because it can operate from a 3.3 V supply.
- Mod1 is a serial-to-USB converter module (BOB-FT232R).
The other three modules (actually two modules and one IC) are connected to the microcontroller over an I²C bus: the Atmel incarnation of this is called a ‘two wire interface’ (TWI). This very widely-used bus allows up to 128 bus participants (‘slaves’) to be connected using just two signal wires. In this circuit the integrated TWI controller in the ATmega88 is configured as the ‘master’ of the following slaves.
- The HP03S pressure sensor from Hope Microelectronics contains a piezoresistive transducer and integrated 15-bit A/D converter (ADC), along with control logic and an I²C interface. The transducer outputs one voltage that depends on pressure and one that depends on temperature. These analogue values are alternately converted by the ADC and the results made available on the I²C interface. During the manufacturing process eleven sensor-specific calibration values with a length of two bytes are stored in the device’s EEPROM, and these can also be retrieved by the microcontroller. A 32 kHz clock with an amplitude of 3 V is required to drive the ADC: since the 32 kHz oscillator on the ATmega88 has an output amplitude of only about 0.5 V, a BS170 (T1) is used for amplification.
- The HH10D humidity sensor is made by the same manufacturer (Hope Microelectronics). A humidity-sensitive capacitor is used as the transducer element, determining the frequency of an ICM7555 timer IC. The frequency, in the range 6 to 7 kHz, is measured by the ATmega88 and then converted into a relative humidity value with the help of two calibration parameters again stored in a serial EEPROM in the module. The ATmega88 measures the frequency by counting the output pulses of the module over a one second period using the 16-bit counter TIMER1.
- The I2C serial EEPROM type 24AA512P (IC1) has a capacity of 64 KB and stores the measured quantities (elapsed hours, time, humidity, temperature and pressure). Up to 8191 data records can be stored.
Three pushbuttons are provided for the user interface to the device. S4 is used to select between (rechargeable) battery and USB power for the unit, and K1 allows an AVRISP or compatible programmer to be connected.
Software
The firmware for the microcontroller is written in C and compiled using AVR-GCC 4.3.0 (WinAVR 20080610). Separate source files are used for the functions corresponding to each module.
The main program in weather_station.c calls as required routines in lcd_driver.c (to control the display), usart_driver.c (to control the serial interfaces via the USART) and TWI_driver.c (for I²C bus control). There are device-specific functions within each of these files.
TIMER2 is driven by the 32.768 kHz crystal and is configured to generate an interrupt once per second. The interrupt service routine TIMER2_COMPA_vect increments the current time (expressed in hours, minutes and seconds) and sets the event variable flag1sec. At the beginning of each minute a test is made to see whether a new set of readings is to be stored: this is done a preset number of times per hour. If new readings are required the event variable flagmstor is set.
These variables are checked in the infinite loop in the main program. If flag1sec is set then the microcontroller is switched at the fifty-ninth second of the minute from SLEEP_MODE_POWER_SAVE to SLEEP_MODE_IDLE (which re-enables IO_CLK), so that TIMER1 can measure the frequency of the signal from the humidity sensor.
If the variable flagmstor is set then a reading is collected from the pressure sensor module, the calibration correction calculations are carried out, and the final results are written to the I²C EEPROM. The CPU then returns to SLEEP_MODE_POWER_SAVE and waits for the next interrupt from TIMER2.
Construction
The double-sided printed circuit board is, like the circuit diagram, very straightforwardly laid out. Apart from the pressure sensor all the components are leaded and are mounted normally. It is best to start with the SMD pressure sensor, which is not too tricky to solder by hand to the underside of the board. Also mounted on the underside of the board are the three buttons S1 to S3 and the sockets for mounting the LCD module. Sockets are soldered on the component side of the board for mounting the humidity module and the serial-to-USB module. It is a good idea to use sockets for the two ICs.
The fuse settings which are to be programmed into the microcontroller using the ISP connector K1 are given in the text box. The programming job (and connector K1 itself) can be avoided if a ready-programmed microcontroller is used: this, along with the sensor modules and the serial-to-USB module, is available from the Elektor shop.
After carefully checking your soldering you can switch the logger on for the first time. Make sure S4 is in the correct position to select between external power (3.3 V at BT1) and power over USB. The unit requires no calibration.
Operation
The three buttons (S1, S2 and S3) allow the time and other parameters to be set. Table 1 gives an overview of the functions of each button.
Button S1 cycles between various function modes (numbered 0 to 4 and corresponding to the rows of the table) for S2 and S3. Each press of S1 advances to the next mode. Each row of the table indicates what S2 and S3 do in that mode.
To transfer stored readings to a host PC or laptop first connect it to the module using a USB cable.
The microcontroller can detect whether the 3.3 V supply is available from the BOB-FT232R module using port pin PD6.
The PC can retrieve data from the unit over a virtual serial port using the interactive commands described in Table 2, for example with the help of HyperTerminal or HTerm.
Power supply
The weather logger operates from a supply voltage of nominally 3.3 V, which, when it is powered over USB, is available at pin 17 (VCC) of the BOB-FT232R serial-to-USB converter module. For stand-alone operation the unit can be powered via BT1 using a supply voltage between 3.5 V and 30 V and an LDO regulator (IC3). Diode D1 protects against accidental reverse polarity connection.
It is important to employ various current-reduction measures to maximise battery life in stand-alone operation. The ATmega88 microcontroller is responsible for the majority of the power consumption, and so we concentrate our efforts there. The measured current draw of the entire circuit at 3.3 V under various conditions is shown in Table 3. When using a battery pack consisting of three alkaline or NiMH AA cells (i.e. 4.5 V or 3.6 V; nominal capacity of between 2 Ah and 3 Ah) the weather logger can record data for at least 1000 hours. Instead of three AA cells, feel free to employ a single Li-Ion or LiPo cell supplying 3.6 V or 3.7 V respectively.
One power-saving measure is to carry out only one measurement per minute rather than one every second. At one-minute intervals we update only the time, the record count and the elapsed hours timer on the display. The device goes into this mode when no button is pressed for a period of 100 seconds.
Measurements show that the system draws an extra current of about 2.5 mA for about 120 ms when taking a reading; in between these peaks are peaks lasting just 10 ms corresponding to the 1 Hz interrupt.
The device is switched from POWER_SAVE mode into IDLE mode for the fifty-ninth second of the minute. This enables the I/O clock in the microcontroller, which is needed in order to be able to count the pulses from the humidity sensor: the final reading is then available in the sixtieth second. This power-saving trick is only effective if the ATmega88 is operated with a 1MHz CPU clock: the necessary fuse settings are given in the text box.
Displaying the results
The free software package gnuplot can be used to help display the results on a PC in graphical form. The steps required to produce graphs, including the transfer of data to the PC using HyperTerminal or HTerm, are given below. The filenames used correspond to the example.
1. Set up HTerm on the PC to read data over USB as follows:
- COM3 9600 baud 8N1
- newline at: CR
- send on enter: CR
- storage format: RAW
2. Put the weather logger into USB mode:
- connect the weather logger to the computer with a USB cable;
- press the ‘function’ button S1 until the message ‘UART-control>USB’ appears;
- press S2 for ‘continue’: the message ‘USB-UART active’ should appear.
3. In HTerm give the command ‘p2’.
- Data transfer will start with the format:
Hours Temperature*10 Humidity Pressure*10
- Stop data transfer by typing ‘x’.
- Save the received data as ‘pltdata0.txt’.
4. Plot the data using the Windows version of gnuplot (‘wgnuplot’).
- Open the file ‘plotfile0.plt’, which contains the plotting commands for wgnuplot that will result in the creation of the following three image files:
ptemp0.png (temperature graph)
ppres0.png (pressure graph)
phumid0.png (humidity graph)
These three image files can be opened in a graphics editor or included in a word processor document using Word or OpenOffice.
Published in issue 417, September 2011
Main PCB, bare, 100888-1
ATmega88-20PU, programmed, 100888-41
HH10D humidity sensor module, 100888-71
HP03SA air pressure sensor module, 100888-72
Kit incl. PCB, controller, humidity sensor and air pressure sensor modules, 100888-73
Want to build a project?
Bring your design to life with the Elektor PCB Service, powered by Eurocircuits. Upload the project files and order professionally manufactured PCBs or assembled boards through a proven European production platform.
Supporting KiCad, Eagle, Gerber, and ODB++ formats, the service is suitable for everything from prototypes and validation builds to series production and volume manufacturing.
Made in Europe. Fast. Reliable. Professional.
Discussion (3 comments)