
Crisis structurally changes energy business
on
Crisis structurally changes energy business
Statistics and analysis presented this week by BP – at the launch of its annual Statistical Review of World Energy – suggest that the worst global recession since the second world war has not just temporarily hit demand but also caused – or accelerated – structural changes in the industry: a shift in demand from OECD to non-OECD countries, a disconnect between oil and gas prices, strengthened control of OPEC over oil prices, an increased integration of global gas markets, increased fuel switching in the electricity sector from coal to gas and the rise of renewables. These trends are likely to persist long after economic and energy demand growth have bounced back.
 |
| Iain Conn, BP's Chief executive Refining and Marketing, presented the BP statistical review 2010. |
To begin with, the only sign that anything was out of the ordinary was the absence of chief executive Tony Hayward, who was busy dealing with the political fall-out of the oil spill in the US. His place was taken by Iain Conn, group managing director and head of refining and marketing. However, the event was over-shadowed by BP’s troubles in the US. This was reflected in much of the subsequent media coverage, which focused on a verbal attack on Hayward by the US President, Barack Obama, and yet another precipitous drop in BP’s share price.
This was a pity because – following the worst global recession since the Second World War – several important messages emerge from the statistics and BP’s analysis of them. The most significant is that the recession – at times in combination with other emerging trends, like the ‘silent revolution’ in shale gas production – has changed the energy business in ways that are likely to persist long after economic and energy demand growth have bounced back. Indeed, according to Conn: ‘Last year’s decline in global energy consumption was rare – and, where we have data so far in 2010, energy consumption is again on the rise.’
Shifting demand
What do the raw numbers tell us about the impact of the recession on demand? The data show that global primary energy consumption in 2009 fell by 1.1% compared with 2008, the first decline since 1982, and in volumetric terms the largest decline since the BP data series began in 1965. Demand fell in every region except for the Middle East and Asia Pacific. In all regions, growth was below the ten-year average. Because of the strong correlation between economic growth and energy consumption, BP attributes the fall primarily to a 2% decline in the global economy, the first such decline since the second world war.
However, the global averages mask a wide disparity between regions, notably between the relatively wealthy countries of the Organisation for Economic Co-operation and Development (OECD), and the rest of the world. Gross Domestic Product (GDP) in the OECD economies was down 3.4%, while, on average, the non-OECD economies saw their GDP grow by 2.4%.
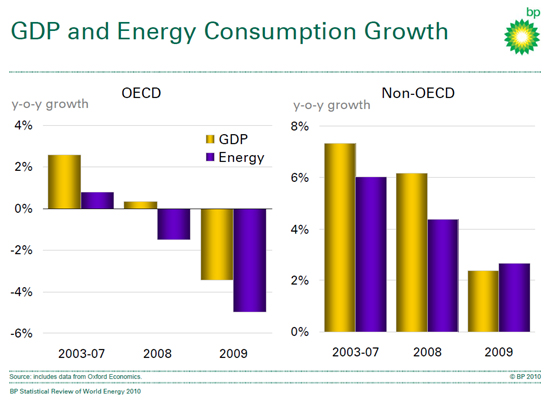 |
| This graph shows how energy demand fell faster than GDP in OECD countries while energy demand grew faster than GDP in non-OECD countries. |
These numbers highlight the first of the big structural changes taking place in the global energy economy: a profound shift in energy demand growth from the OECD economies to the industrialising economies of the developing world. As BP reported last year, in 2008 non-OECD energy demand was higher than that in the OECD for the first time. This shift is a long-term phenomenon but, according to BP’s chief economist, Christof Rühl, who again presented BP’s Statistical Review this year, the 2008/9 recession has accelerated the trend.
Even the non-OECD average hid a big disparity: ‘Energy growth was concentrated in China and India, where consumption rose by 8.7% and 6.6%, respectively,’ said Rühl. ‘Without the contribution of India and China, non-OECD energy demand would have fallen by 1.5% instead of growing almost 3%; and global energy demand would have fallen by almost 4% instead of the 1% actually recorded.’
A notable feature of non-OECD demand growth was an increase in energy intensity (the amount of energy consumed per unit of GDP) in the non-OECD economies – for only the third time in two decades. This is largely explained by China’s efforts to avert a collapse in industrial activity by undertaking infrastructure projects on a grand scale. ‘China’s stimulus package was of enormous importance in stabilising global demand,’ said Rühl, adding that: ‘The increase in coal and oil [consumption] mirrors an increase in cement and steel production, and of other industries required for infrastructure development, such as asphalt using oil.’
As with the regions, the averages mask big differences between fuels. Natural gas was the hardest hit, with 2009 demand down 2.1% on 2008. Consumption fell in both OECD and non-OECD countries, with a particularly severe decline in the former Soviet Union. Oil consumption fell by 1.7%, the steepest decline since 1982. Coal consumption was flat, but only because growth in China and India offset large declines elsewhere. ‘The OECD, the European Union and the former Soviet Union all saw the largest decline in our records,’ said Rühl.
Down, down, deeper and down
With demand under pressure from recession, it came as no surprise that, for the year as a whole, prices for all forms of traded energy fell, as the accompanying chart shows. ‘Global fuel prices all declined, and then stabilized or increased as the recovery took hold.’ said Rühl. ‘But the pattern after the initial decline differs widely across fuels, each telling its own story. Prices mirror overall conditions and so they provide a good first approximation of what happened on the supply side.’
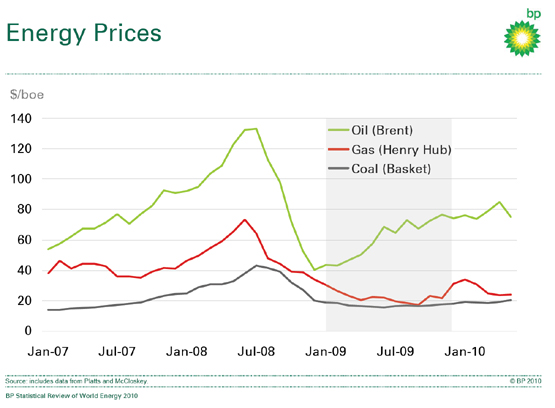 |
| The graph shows a wide divergence between oil and coal/gas prices. This is partly explained by the successful defence of the oil price by OPEC, which cut production in 2009 (see the graph below). |
The prices of crude oil recovered early in 2009, after a precipitous fall from their peak in July 2008, at a time when oil demand was still falling. Spot prices for natural gas prices declined and remain low today. Coal prices recovered only gradually – more so in Asia Pacific and in direct response to accelerated Chinese and Indian import demand.
This highlights two other structural trends, one affecting oil supply and the other gas supply, which together have led to a wide divergence of oil and spot gas prices – leading many to speak of a ‘disconnect’ in the traditional relationship between the two.
Co-operating cartel
Oil prices recovered while demand was still falling because, in 2008, the oil producers that make up the Organisation of Petroleum Exporting Countries (OPEC) had agreed deep cuts in production. Alarmed at seeing prices plummet from nearly $150/barrel in July 2008, to a low of almost $30/barrel by the end of the year, OPEC members maintained an unusual level of discipline during 2009 that led to prices recovering and stabilising in a range of $70-75/barrel. Prices remain close to that range today, averaging $77/barrel in the year to date.
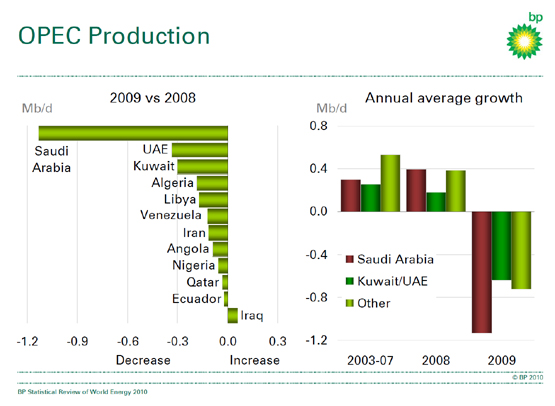 |
| OPEC members maintained a high level of discipline in 2009 in meeting their production cuts. |
‘Unlike other markets,’ said Rühl, ‘the oil story highlights the significance of a producer cartel and its ability to manage supply . . . OPEC reductions did not catch up with declining demand until the second quarter of 2009 . . . Discipline varies, but every OPEC member participating in the agreement reduced production in 2009. That said, the cuts have been highly concentrated. Saudi Arabia’s production declined by 1.1 million b/d, by far the world’s largest decline and the steepest Saudi cut since 1983.
‘There are plenty of sub-plots in the oil market– the role of speculation and of subsidies, the relationship between oil and other asset classes, and the persistent contango in forward prices. At a high level, the story for 2009 – and so far this year – is that production fell by more than consumption, which tightened inventories and supported higher prices. Future price movements are likely to be shaped by these same fundamental forces.’
Global gas glut
Gas supply, in contrast, was boosted by two factors that reinforced each other: the rise of unconventional gas production in the US, notably from shale resources; and a new wave of LNG production as gas liquefaction projects initiated in the boom years of 2004-2005 started up. Moreover, the growing contractual flexibility of LNG transportation meant that the US shale gas developments had repercussions in regional markets around the globe – especially in Europe.
The unconventional gas revolution in the US has helped to boost its proved gas reserves by almost 50% over the past decade. In 2009 the US had the world’s largest gas production increase for the third year running, according to the BP statistics – one consequence of which is that the US has overtaken Russia as the world’s largest gas producer.
‘Last year,’ said Rühl, ‘we reported production per rig in the US rising exponentially, as the new technologies disseminated. In 2009, the overall rig count fell steeply, while production increased due to prolific shale deposits, which now have become the cheapest source of supply . . . Momentum is continuing so far.’
The much-discussed disconnect between the prices of oil and natural gas has led to unusual tensions in gas markets. While prices in liberalised markets dropped sharply, because they are driven by gas-on-gas competition, prices in oil-indexed long-term gas contracts have, of course, held up much better.
Prices in the liberalised markets of the US and the UK were around 55% lower year-on-year; oil-indexed prices, sheltered by the higher price of oil, fell by much less. The Average German Import Price (AGIP) fell by 26% and the LNG price in Japan by 28%. Unusually, oil-indexed prices have stayed above spot prices throughout 2009 and to date in 2010.
‘Underneath these adjustments to the economic situation, structural and cyclical changes are reshaping global gas markets,’ said Rühl. ‘Regional markets remain segmented, but arbitrage increased. A wave of new supplies boosted LNG trade by almost 8% in 2009 while pipeline trade declined. LNG now constitutes 28% of all international trade. Together with a structural increase in the production of unconventional gas in the US, this accelerated the integration of global markets and challenges the traditional pattern of gas flows and pricing in Europe.’
Fuel switching
One consequence of low gas prices in traded markets is that gas has been challenging coal in electricity generation. In the US electricity generation from coal was down 11% last year while gas-fired electricity generation was up 5%. Despite this extra demand, overall gas demand fell so steeply that imports had to be curtailed by 10%. That not only affected pipeline supply from Canada but also led to much less LNG being imported into the US than had been expected.
With gas consumption down in the traditional LNG markets of Japan, South Korea and Taiwan, and the new wave of LNG supply emerging from new projects, flexible LNG sought the best available prices and much of it found its way to Europe. This kept European spot prices low, prompting European customers to ramp down volumes of oil-indexed pipeline gas, within the tolerances specified by take-or-pay contracts so that they could take cheap LNG instead. Meanwhile, as in the US, gas displaced coal in power generation.
Overall, European imports of pipeline gas from North Africa and Russia were down 13%, while net purchases of LNG were up 23%. Russia, faced with steep demand decline at home and in its export markets had to reduce its production by 12%, or 74 Bcm, the world’s biggest decline in volume terms.
‘As a result of declining demand for European pipeline imports, signs of flexibility emerged,’ said Rühl. ‘A number of European buyers re-negotiated penalties or received an extension for take-or-pay deliveries. And in February of this year, Gazprom announced it would index any gas above the minimum take-or-pay volumes to spot rather than to oil prices. Statoil employed similar measures. The pressure on oil-indexed gas prices had spread to European pipeline trade.
‘Ironically, a year which had started with Russia suspending gas exports to the Ukraine and Europe in January 2009, ended with progress towards a more flexible and better integrated global market. The future will show whether the structural effects of greater trading and unconventional gas can persist, once the cyclical effects of an oversupply of LNG are corrected.’
Yet another structural shift in energy, though not related to the recession, has been the rise of renewables, especially wind-power, the installed capacity of which grew by almost a third, 38 GW, in 2009, with growth accelerating for the fifth year in a row. However, non-hydro renewables – meaning wind, solar and geothermal power – remain small players. Last year they contributed an estimated 1.7% to total power generation, or just 0.7% of primary energy consumption.
‘We currently don’t include wind, solar and geothermal in primary energy,’ said Rühl, ‘but I hasten to add that we will next year. Data quality is improving and they are reaching sufficient weight in a number of countries.’
One message that hasn’t changed – again – is the level of oil and gas reserves, which, said Rühl, ‘remain sufficient to meet demand growth’. Indeed, over the past decade the reserves-to-production (R/P) ratio for oil has risen from 41 years to 46, while for gas it is 63 years. ‘Over the last decade,’ said Rühl’, ‘proved oil and gas reserves have grown in every single region [as the chart below shows].’
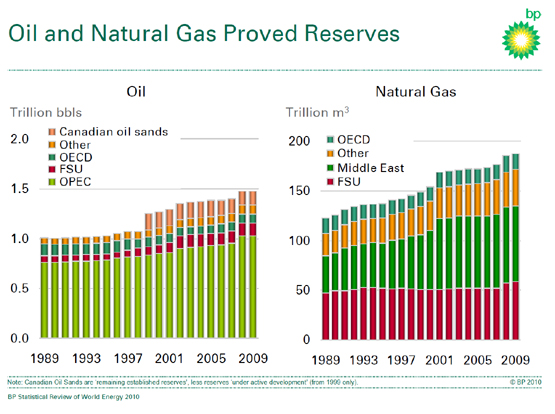 |
| Worldwide global gas and oil reserves stayed at roughly the same level in 2009. |
But reserves are one thing and getting them out from under the ground, or below the sea, is another. So a structural change that BP and the rest of the world could do without is the rapid change in attitudes to deep-water drilling that has been one of many unfortunate consequences of the Gulf of Mexico spill.
As Iain Conn said: ‘Last year’s decline in global energy consumption was rare . . . The world needs to invest today to be able to deliver the energy supplies that will be needed in the future. Events in the Gulf of Mexico, however, demonstrate that access to some energy resources will almost certainly require enhanced measures to ensure safe operations and capabilities to safeguard the environment.’ Quite.
Discussion (0 comments)