Open markets to the rescue - the story of energy in 2011, and its lessons for the future
on
Open markets to the rescue - the story of energy in 2011, and its lessons for the future
Despite energy supply disruptions of unprecedented scale - and against a backdrop of ever-rising demand - energy markets coped surprisingly well in 2011 in "keeping the lights on". So said BP yesterday as it launched its 61st annual Review of World Energy Statistics. This was thanks largely to the proper functioning of open and competitive markets and the growing interdependence and interconnections that characterise the global energy system. Long-term trends continued to assert themselves, especially the shift of energy consumption from the industrialised to the emerging nations and, worryingly, our continuing failure to bring greenhouse gas emissions under control. Alex Forbes reports from London.
 |
| BP's chief executive Bob Dudley (c) AP PHOTO |
If you consider only the aggregate data for global energy demand, economic growth and energy intensity, 2011 looked an unremarkable year for the world's energy economy. Energy demand grew by 2.5%, in line with the ten-year trend, while global economic growth of 3.7% was also in line with its long-term trajectory. So, therefore, was energy intensity - the amount of energy consumed per unit of GDP. It improved by 1.1% - again, close to trend.
Yet, as we all know, 2011 was a remarkable year in many ways, not least in that it was marked by major energy supply disruptions. The Arab Spring saw oil and gas supplies disrupted, especially as war took hold in Libya. According to BP data, the cessation of oil exports from Libya removed 1.2 million barrels/day (b/d) of crude supply for the year; adding outages of gas and losses in other countries gives a total reduction of 72 million tonnes of oil equivalent (Mtoe) on 2010. The Great East Japan Earthquake and the subsequent tsunami led to a nuclear crisis in Japan that had major knock-on effects on other countries and on other fuels. The damage to coal-fired stations in Japan, and the closure of nuclear reactors in Japan and Europe, led to losses of 43 Mtoe for the year. For the first time ever, we saw an annual average oil price above $100/barrel - and there was a release of strategic oil reserves for the first time since 2005. In Australia, huge floods affected production of coal.
At the heart of this apparent disparity is the encouraging message - as outlined by BP's chief executive Bob Dudley yesterday as he launched the new 2012 edition of the Statistical Review - that the global energy supply system coped surprisingly well with these unprecedented disruptions. In short, Dudley and his chief economist Christof Rühl told a story of resilience in the face of adversity.
Interdependence and interconnection
A key lesson of that story is that it was the world’s growing energy interdependence and interconnection that allowed markets to do the work of reconfiguring the global energy system to ensure that supplies ended up where they were most needed.
Both Dudley and Rühl pointed to what happened in Japan, where large-scale diversions of LNG, and other fuels, helped keep the lights on despite the progressive and now total shut-down of Japan's once-mighty nuclear electricity industry.
So much for the political goal of energy independence - popular in the United States and elsewhere. Had Japan been aiming at such a goal, said Rühl, it would have been unable to cope as well as it did with an energy crisis of epic proportions, at the same time as dealing with one of the great human tragedies of our times.
"The ability of supply to meet demand at an affordable price depends on two things - markets and infrastructure," said Dudley. "We need open markets to channel supplies to where they are needed, and
| Where competition flourishes suppliers build infrastructure, develop technology and pursue innovation to get competitive edge |
we need the infrastructure to ensure sufficient supplies are available. The open market is something that governments provide, while the infrastructure is largely something industry provides. Both matter. Where competition flourishes suppliers build infrastructure, develop technology and pursue innovation to get competitive edge. There is a chain reaction from competition to innovation and increased supply and affordability."
Dudley pointed to the US as an example of "how an open and competitive environment drives technological innovation and unlocks resources". Not only has the shale gas revolution in the US unlocked vast new supplies of gas, driving prices sharply downwards, we are now seeing a similar phenomenon in oil production growth. Production of shale liquids gave the US the largest increase in oil production outside OPEC for the third year running, helping to reduce US imports sharply.
"The advent of shale production on this scale - driven by advances in technology - is one of the biggest developments in the industry in several decades," commented Dudley. "The good news today is that we're seeing a whole range of areas where this process of competition, innovation and growth is generating results. These include shale gas, deep-water oil and gas; heavy oil; and, potentially, advanced biofuels."
Diverging prices
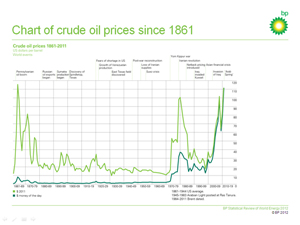
Price signals played a crucial role in reconfiguring the global energy system. The average annual (Dated Brent) oil price was up 40% on 2010 to $111/barrel. Meanwhile, regional gas prices diverged sharply, pushing natural gas – and coal – away from oversupplied North America towards the energy-hungry markets of Asia Pacific, and, to a lesser extent, Europe.
 |
| Chart of crude oil prices since 1861 (click to enlarge) |
"A simple average of the international coal marker prices we publish in the statistical review increased by 24%," said Rühl, "with the biggest increase in Europe, and with US coal prices approaching US gas prices. While US gas prices continued their decline following the shale gas revolution, oil-indexed prices outside the US increased, pulled up by the rising price of crude, and spot prices followed suit."
What we have yet to see is how price trends will affect the still-troubled global economy. "With so many economies dependent on imported oil and gas," said Dudley, "the risk of high prices is that, rather than economic factors driving energy prices, energy prices could drive economies downwards." But Rühl added that while there is a broad consensus that very high energy prices can adversely affect economic growth, there is no agreement at what levels these effects start to manifest themselves.
A very significant development of recent years, largely driven by the high level of oil prices, has been a fall in the subsidisation of energy supplies, especially in the case of oil.
“Only about 20% of the world’s oil consumption was in countries with subsidies last year,” said Rühl, “down from nearly 40% in 2008, the last year of record high oil prices. Because subsidies are expensive and because of the realisation that energy efficiency matters in international competition, the cycle of rising oil prices resulting in rising subsidies appears to have been broken. We estimate that non-OECD countries passed roughly 70% of last year’s oil price increase on to consumers, up from about 25% in 2008.”
Long-term trends continue to assert themselves
Not only did primary energy demand, GDP growth and energy intensity return to the long-term trends, after the wobbles of 2009 and 2010, several other trends continued to assert themselves: the ongoing shift of energy consumption growth from the OECD economies to the emerging economies; a shift in the fuel mix that is not apparent from the aggregate data; and our continuing failure to bring emissions of carbon dioxide under control.
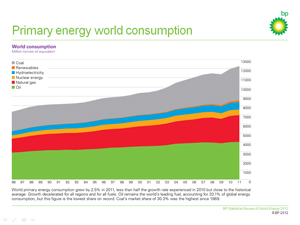
"Non-OECD consumption growth of 5.3% stayed firmly on trend last year, with China growing at 8.8%," said Rühl. "OECD energy consumption, in contrast, fell by 0.8%, despite average GDP growth."
 |
| Primary energy world consumption (click to enlarge) |
He gave three broad reasons for the OECD trend: the impact of high oil prices, and of high coal and gas prices outside North America, and the fact the OECD energy prices are the least sheltered by subsidies; the impact of Fukushima, which led to a decline in Japan's energy consumption of 5%, with knock-on effects in Germany; and a swing to warmer weather in Europe, the main factor behind a 3.1% decline in its energy consumption.
The energy dislocations in the OECD give another indication of how markets coped with the disruptions that characterised 2011, added Rühl. "Fuel substitution, supply and demand responses and trading patterns all played their role."
In short, three major adjustments took place: an increase in oil supplies, notably from Saudi Arabia, together with flexibility in trading and the global refining system, allowed heavier Saudi crudes to replace lighter Libyan oil in Europe; natural gas diverted from Europe allowed the substitution of lost nuclear energy in Japan "without harming the energy needs of other economies" in this region; and, remarkably, the release of coal from the Americas, facilitated by the boom in unconventional gas in the US, helped to replace gas in Europe.
Long-terms trends in the energy mix also continued to play out, said Dudley. Oil demand in 2011 grew by just 0.7%, a little over half the ten-year average, to 88.0 million b/d, despite global GDP staying on trend. Its share in the global energy mix continues to fall. Rühl added that "in oil, the OECD decline can already be called structural".
Demand for natural gas grew by 2.2% to 3,220 billion cubic meters (bcm), while international trade outpaced consumption, growing by 4%. The lion’s share of this was in LNG, which grew by more than 10%, which compares with just 1.3% for pipeline trade. "More than 10% of all gas consumed reaches its destination as an LNG cargo," said Rühl. BP - like other commentators, including the IEA - sees a bright future for gas, especially in power generation, despite the ongoing controversy over the environmental acceptability of shale gas production.
Coal still king
The bad news for those who worry about climate change was that in 2011 carbon emissions continued to grow as coal was once again - shockingly - the fastest-growing fossil fuel, with global consumption up by 5.4% on 2010.
Renewable energy sources grew even faster, by 13%, but from such a small base that they currently account for just 2% of global primary energy demand, despite years of double-digit growth.
Dudley pointed to some positive signals, for example the declining use of energy in the OECD, which "reflects progress in energy efficiency and demonstrates what it can achieve". But, however you slice it, it is abundantly clear that we still have a very long way to go to reach a genuine low-carbon global energy economy.


Discussion (0 comments)