Ranking European gas markets
on
Ranking European gas markets
In this article, Catrinus Jepma and Santiago Katz of the Energy Delta Institute show how the widely accepted indicators of market performance in the European "Gas Target Model" can be turned into a methodology that gives a simple, transparent score for each European gas hub. Applying their methodology, the authors conclude that most North West European gas markets are functioning (reasonably) well. And the winner is ... you guessed it: the UK's National Balancing Point.
 |
| Most North West European gas markets are functioning (reasonably) well (c) RT.com |
One major limitation of CEER's proposed Gas Target Model (GTM) is that it is purely binary: either all its requirements are met simultaneously, or they are not. In other words, markets either function, or they fail to function. This makes it impossible to grade the functioning of a gas market or to compare gas markets to each other. This is regrettable, as markets do not simply function or fail to function, rather they develop over time and achieve varying degrees of functionality throughout this process. The approach we take in this paper attempts to capture this reality and communicate it in a pragmatic manner.
We apply our methodology by measuring the performance of Northwest Europe's eight leading gas hubs: Britain's National Balancing Point (NBP) the Title Transfer Facility in the Netherlands (TTF), Belgium's Zeebrugge Hub, and a hypothetical combination of Germany's two hubs, NetConnect Germany (NCG) and Gaspool (GPL), Austria's Central European Gas Hub (CEGH), France's Point d'Echange de Gaz (PEG), and Italy's Punto di Scambio Virtuale (PSV). The results, as we shall see, are more than encouraging.
However, before we discuss our methodology further, we would like to remind our readers that, as we argued in our previous article, the relevance of CEER's GTM to the real gas market is limited in the sense that it applies only to the "spot" element of wholesale markets, not to long-term contracts. There are two reasons for this. First, the indicators selected by the CEER that are intended to measure the functioning of markets, simply do not lend themselves to measuring long-term contracted (LTC) gas contracts. The inherent opacity of these contracts makes it practically impossible to incorporate their volumes and trading into the GTM's calculations. Secondly, the CEER's GTM actively seeks to push LTC gas to border points, yielding what is essentially an internal spot market for gas.
Transparent system
The CEER GTM uses five indicators to measure the functioning of gas markets: the Herfindahl-Hirschman Index (HHI), which measures the level of competition in a given industry or sector by looking at the market shares of the 40 largest suppliers; the Residual Supply Index (RSI), which measures the capacity of non-dominant suppliers to the market, and their ability to sustain supplies; the number of sources of gas servicing the market; the size of aggregate market demand; and the churn rate (the volume of trades compared to the physical volume).
We believe that by organizing the CEER's five indicators into a more explicit grouping of three primary characteristics (i.e. competition, security of supply and liquidity), and by subsequently aggregating these, it is possible to develop a more balanced and yet simple and transparent scoring system for the functioning of gas markets. Though markets are always more than the sum of their parts, by combining the three scores for competition, security of supply and liquidity, we get a heuristic indicator for aggregate wholesale market functioning. Such an aggregate indicator will enable regulators to compare markets, monitor market formation and assess different degrees of market development.
Because each indicator is accompanied by a CEER provided benchmark, each market characteristic can easily be scored, and will therefore result in a discrete number. For example, the CEER benchmark for liquidity is a churn factor of 8. This means that a market whose churn factor is equal or greater than 8 will receive a score of 100 or greater. In the case of competition and security, because there are two indicators for each, the score is simply the average of the two indicators.
The next challenge is to design a model in which the three scores can be summed to create an aggregate market functioning score. We distinguish two possible ways of doing this, and each one implies a different normative understanding of markets and market functioning. We will discuss both of them and see how their results contrast with each other.
The first approach, which we call the Sum of scores, is to take the sum of each characteristic score divided by one-third (since each characteristic should represent a third of what constitutes a functioning market). Because some markets may exceed the benchmarks set by the CEER (for example, a market may have a churn factor of 20), the Sum of scores approach can lead to scores well over 100. This approach implies an organic view of markets, one in which progress in one category can compensate for slower progress in another. For example, it implies that a liquid and secure market may function well despite shortcomings in competition.
The second approach, which we call the Sum of minimums, is mathematically and normatively quite different. Stricter, and more in line with the original CEER GTM, this approach takes the view that market characteristics cannot compensate for one another. Put simply, a functioning market must meet the minimum requirements for each market characteristic. For this reason, each market characteristic score is not allowed to exceed one-third of the total score. They are then summed to form that market’s aggregate functioning score.
Finally, since we reject the notion of a binary methodology for measuring market functioning, we must have an accompanying scale for measuring degrees of market performance. There is always an arbitrary element in adopting such a scale, but this is not important as long as the outcome enables regulators to corroborate results. We have chosen the following scales for scoring market functioning ranges:
- Poorly Functioning Market = 0-50
- Transitioning Market = 50-75
- Well Functioning Market = 75-100+
Encouraging results
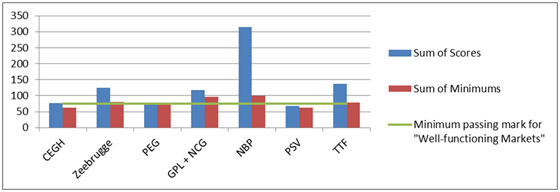
When we apply to the two methodologies to actual spot market performance in North-West Europe, we get rather encouraging results. Several clear groupings emerge. The most obvious but probably not so surprising result is that Britain’s National Balancing Point emerges as the best-functioning European hub.
The Continental Hubs are split into two groups. The first group, the Continent's peloton, as it were, consists of the Title Transfer Facility in the Netherlands, Belgium's Zeebrugge Hub, France's Point d'Echange de Gaz (PEG) and a hypothetical combination of Germany's two hubs, NetConnect Germany (NCG) and Gaspool (GPL). (Note that we combined the two German hubs due to technical difficulties in data collection. The Bundesnetzagentur, the German regulator, does not publish HHI figures for individual hubs, which significantly impacts our ability to make cross-hub comparisons.) These hubs achieve relatively high aggregate market functioning scores regardless of methodology, and achieve relatively similar performances.
The Continent's second group consists of Europe's more moderate-performing hubs: Austria's Central European Gas Hub (CEGH) and Italy's Punto di Scambio Virtuale (PSV).
 |
| Click to enlarge the image |
Thus, with a passing mark of 75, we see that only two hubs fail to be considered "well-functioning" by current CEER standards. From our more pragmatic "Sum of Scores approach," however, all but one of Europe's hubs can be considered well-functioning, though to varying degrees. We have put the same results in the two tables below.
| Sum of Scores | Sum of Minimums |
| NBP 314.12 | NBP 100 |
| TTF 137.16 | GPL + NCG 95.83 |
| Zeebrugge 124.79 | Zeebrugge 79.71 |
| GPL + NCG 117.91 | TTF 78.13 |
| CEGH 76.95 | PEG 76.09 |
| PEG 76.09 | CEGH 62.81 |
| PSV 67.62 | PSV 61.79 |
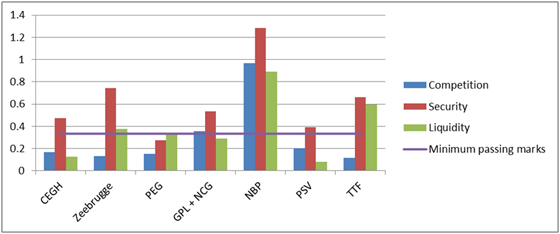
To get a better appreciation of each hub's relative strengths and weaknesses, we also present their individual category scores in the chart below.
 |
| Click to enlarge the image |
From this perspective, we see that the Continent's leading hubs seem sufficiently secure and liquid. However, some members of the peloton appear less competitive than some of the weaker hubs in Europe! Why is this so? It would be mistaken to conclude from this that competition has no bearing on liquidity. Rather, we believe that this is the result of calculating competition on the basis of an inherently incorrect national scope. As we have explained in our previous paper, HHI, though a useful and instructive concept, is based on an outdated application of the relevant market for natural gas spot sales, namely one that focuses on the nation state. Market integration has caused the size of the relevant market for spot gas sales to extend far beyond national borders. Additionally, we note that among European hubs, those with significant transit volumes scored the highest marks for overall market functioning, which is another indication of a wider relevant market concept. It is simply incorrect to assess market functioning from a purely national perspective. We will attempt to tackle this important issue in an upcoming paper dedicating to the subject of what is the 'relevant market.'
Non-hub national markets
For reasons discussed in our previous paper, we believe that our CEER-based methodology should, in principle, be applied solely to the spot elements of wholesale gas markets. Nonetheless, we do recognize that despite some very impressive progress in hub formation in North Western Europe, much of European gas wholesale remains devoid of any real spot component. For this reason, we seek to extend a modified version of our methodology to Europe's non-hub national markets. Nonetheless, we refrain from any comparison between hubs and non-hubs, as we believe this would be meaningless and non-instructive.
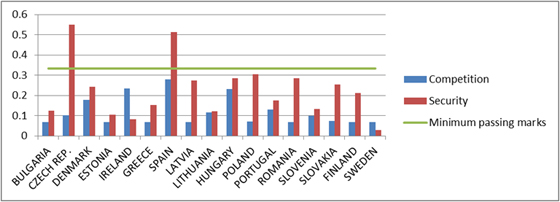
Furthermore, because of the LTC (long-term contracted) nature of gas sales in these markets, we exclude liquidity and focus solely on the security and competition elements of these European national markets. The following bar chart shows the result of a comparison of these two characteristics among non-hub European markets.
 |
| Click to enlarge the image |
We see that these markets seem, on the whole, rather secure and yet not particularly competitive, with the exception of Spain, Ireland and Hungary. Given the LTC nature of gas sales in many of these countries and the ubiquitous problems related to the measurement of competition, we prefer to refrain from making any overarching conclusions about these markets.
Conclusion
We have applied the CEER definition of market functioning in a pragmatic and transparent manner that leads us to conclude that North West Europe's gas hubs represent, on the whole, well-functioning markets. In particular, the NBP, TTF, Zeebrugge, PEG and German hubs (the later two taken as a unit) can, according to our standards, be considered well-functioning. Those hubs that performed more modestly, and which we qualify as "transitioning hubs," attained scores relatively close to the leading hubs. These include the PSV and CEGH. Finally, using a similar methodology, we find that although they may be considered insufficiently competitive, Europe's non-hub national gas markets are, on the whole, secure.
|
About the authors Santiago Katz is energy analyst at the Energy Delta Institute in Groningen, The Netherlands. Professor dr. Catrinus Jepma is professor of energy and sustainability at the University of Groningen and Scientific director of the EDIaal programme at the Energy Delta Institute. |


Discussion (0 comments)