Whenever oil prices abnormally elevate due to a variety of reasons, some of which are beyond human control and some the result of human intervention – the world often panics and the press is filled with articles highlighting that the world is running out of oil, 'peak oil theory', and oil prices are likely to increase to $250/bbl etc.
The term peak oil was originally coined in the 1950s by M. King Hubbert who predicted US oil production wo...
Whenever oil prices abnormally elevate due to a variety of reasons, some of which are beyond human control and some the result of human intervention – the world often panics and the press is filled with articles highlighting that the world is running out of oil, 'peak oil theory', and oil prices are likely to increase to $250/bbl etc.
The term peak oil was originally coined in the 1950s by M. King Hubbert who predicted US oil production would peak in 1970, and decline at the same rate it arose. But in the history of the petroleum era, Matt Simmons will be remembered for calling attention to peak oil. T. Boone Pickens, another peak oil proponent said in a statement, "You had to admire his advocacy and his ability to focus on the need to better prepare for a new energy future." In reality, like many Malthusian beliefs, the peak oil theory has been promoted by a motivated group of scientists and laymen who base their conclusions on poor analyses of data and misinterpretations of technical material. Are we really moving towards resource exhaustion or towards Peak Oil theory? Is the world better off today then it was in 1980 contrary to the predictions of Peak Oil theory?
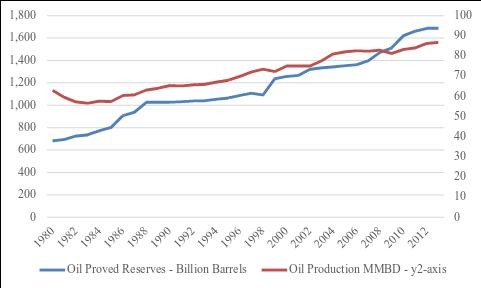
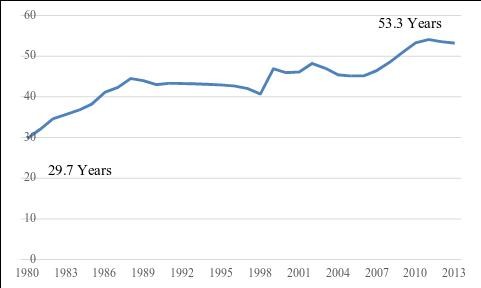
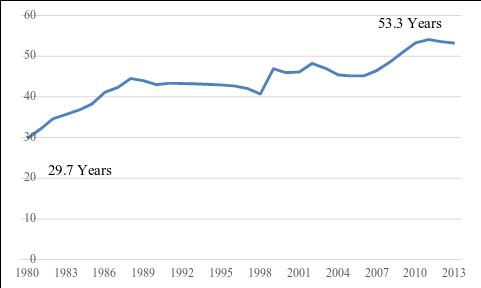
In order to assess the true picture it would be worthwhile to analyse the historical data to arrive at some rational conclusions about whether the world is really running out of oil and gas resources. From global perspectives the world is better off on both the oil and the natural gas front. For example, global oil reserves during 1980/2013, increased from 683.4 billion barrels in 1980 to 1687.9 billion barrels in 2013 – an increase of 147%. While oil production during the same period increased by 38% (Figure-1). Despite, 38% increase in global oil production the world is better off in 2013 than 1980. At the end of 2013 oil reserves production ratio (R/P ratio) [1] increased from 29.7 years in 1980 to 53.3 years at the end of 2013 – an improvement of about 23 years (Figure-2). That means that with 2013 oil production and oil reserves the world can survive for 53.3 years assuming no additional discoveries are made.
Figure-1 Global Proved Reserves & Production Figure-2 Reserves Production Ratio (R/P Ratio) Source: BP Statistical Review of World Energy
Distribution of energy resources
When the historical data is analyzed regionally the situation is quite different. Interesting enough the major consuming regions – North America, Europe and Asia are all experiencing growing demand for oil and gas but lack indigenous resources. Therefore, in general their import dependency over time has substantially increased. In sharp contrast, the bulk of oil and gas resources are located in Middle East, Former Soviet Union (FSU) Central & South America and Africa and exceed consumption in these regions.
Apart from other factors one of the main reasons of higher energy prices is associated with global distribution of energy resources. As a result of uneven distribution of energy resources security of supplies related issues are vital for some regions/countries as compared to others. This led us to review how global natural resources are distributed, produced and consumed. Such analysis will set the stage for discussion and also help understanding the nature of the problem. Only a few countries are dominant energy players in the world today. For example, in terms of fossil fuels - Saudi Arabia, Venezuela, Iran, Iraq and Canada hold 62% of global oil reserves. Russia, Iran, Qatar, USA and Turkmenistan account for about 63% of global natural gas reserves and USA, Russia, China, India and Australia are holding 75% of coal reserves at the end of 2013 (Table-1). While the remaining of proven resources is being shared by the rest of the global economies and some of them are totally import dependent.
Not only the distribution of natural resources is skewed but a major portion of various sources of energy are also being produced and consumed by few countries. For example, over 45% of oil is produced and consumed by the given seven countries - Saudi Arabia, Russia, USA, Canada, China, Japan and India (across row). While over 52% of natural gas is produced and 47.6% consumed by the given seven countries. For coal over 75% of resources are being produced and consumed by the given seven countries. Sixteen countries altogether are the major energy players either as reserve holders, producers, consumers or combination of the three.
For example, USA, India and China are the largest holder, producer and consumer of coal. Similarly, Russia and Iran are among the top natural gas reserve holders, producers and consumers. While equation for oil is somewhat different and not the largest oil reserve holders aren't necessarily among the top five oil producers and consumers as well. For example, Saudi Arabia and Canada are among the top five oil reserves and producers but not among the top five consumers.
Table-1: Matrix of Fossil Fuels Profile - 2013
BP Statistical Review of World Energy – June 2014.
Technological Breakthroughs
Over the years, new state-of-the-art technology played an important role in reducing cost and boosting oil and gas production from high cost deposits like deep offshore reservoirs thereby making more production economically possible. For example, introduction of 3-D seismic, horizontal drilling, multi-completion of wells and hydraulic fracturing, has greatly increased exploration success rates, improved recovery rates, and substantially reduced the cost of producing oil and gas.
With the application of new technology, oil supply in the North Sea increased significantly during 1980s. This gave a significant boost to non-OPEC production (reducing the call on OPEC production) and consequently oil prices plunged in 1980s. Recently due to technological advancement and change in definition Central & South America recorded a substantial boost in oil reserves – increasing from 111.2 billion barrels in 2007 to 229.6 billion barrels in 2013. This increase is mainly associated with significant increase in Venezuela oil reserves (heavy oil) that increases from 99.4 billion in 2007 to 298.3 billion barrels in 2013 – an increase of over 200% in just seven years! Horizontal drilling and fracturing technology has opened up a new era of oil and gas from tight/shale oil/gas and sand oil in North America.
Outlook
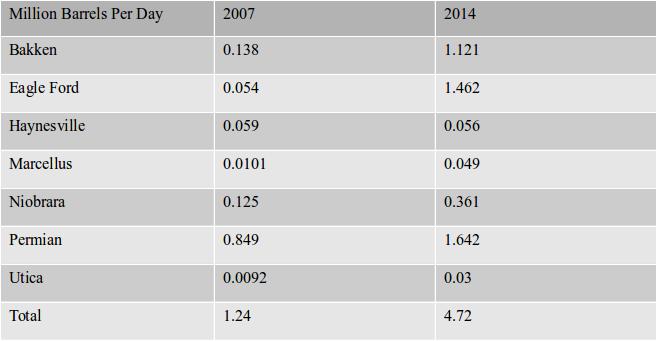
Due to the dynamic nature of the oil and gas industry and continuous advancements in state-of-the-art technology the world we live in in 2015 is much better than the one we were living in in 1980. Both oil and natural gas reserves and life expectancy during this period have improved despite substantial increase in production/consumption. Horizontal drilling, 3-D and hydraulic fracturing allow the recovery of oil and natural gas from unconventional resources (shale, coal bed methane, and tight formations) which otherwise were uneconomical to produce. The global unconventional industry (tight oil, shale oil, shale gas, sand oil) is still at the learning stages but the United States industry is far ahead and has shown inspiring results as their tight oil production increased from 1.24 million barrels daily (MMBD) in 2007 to 4.72 MMBD in 2014 – which represents approximately a 3-3/4 fold increase1- reducing US oil import dependency from 60% in 2005 to about 27% in 2014.
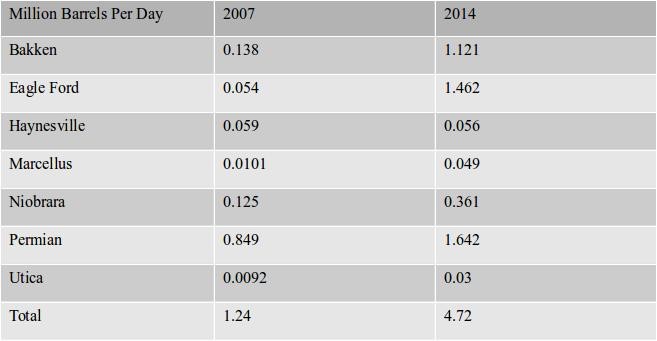
The major boost in US oil production is associated with tight oil production that increased from 1.24 MMBD in 2007 to 4.72 MMBD in 2014. North Dakota has been an oil producing state for the last 60 years. However, the Bakken oil boom since the last eight/ten years made North Dakota the fourth largest oil producing state in the country and one of the largest onshore plays in the United States. The Bakken extends beyond North Dakota into Eastern Montana and neighboring territories of Saskatchewan and Manitoba in Canada. While its success has been largely attributed to advances in oil field technology, primarily horizontal drilling and hydraulic fracturing, a number of circumstances have come together to make the Bakken a successful oil play, including high oil prices, widespread and ready access to privately held prospects. For example, Bakken oil production from tight oil increased from 0.138 MMBD in 2005 to over 1.121 MMBD in 2014. According to US Geological Survey there are at least 4 billion barrels of recoverable oil in North Dakota, other estimates indicate 4-5 times more. Other important prospects are Eagle Ford and Permian basin where tight production also substantially increases (Table-2). The additional oil production from tight oil is further complemented by substantial increase in condensate from increasing shale gas production. The combined effect of both these and other factors allowed the US to reduce its net oil import dependency from 60% in 2005 to below 27% in 2014, despite the growth in domestic oil demand that was hovering around 18 MMBD recently.
Table-2: US Tight Oil Profile
Source: Energy Information Administration (EIA)
The problem is when oil prices skyrocketed the peak oil theory re-emerged and during the regime of collapsing oil prices the concept of peak oil remains on the back burner. I leave it up to the curious readers to make their own rational assessment whether the world has reached the peak or is endowed with substantial resources to meet the ever increasing energy demand for mankind for many decades to come. One thing is certain, the future will be much better than the present as human ingenuity blessed by Allah SWT is unlimited – technological breakthroughs help humanity to find and extract shale oil/gas, sand oil and other energy resources (renewable and non-renewable) economically in major energy consuming countries. Before these resources are exhausted we will discover something amazing. This process of innovation and improvement in standard of living can be expected to continue for many centuries and the world will still be debating peak oil!
1. Also known as life expectancy of oil reserves in years.
Dr. Salman Ghouri is Senior Economist at Qatar Petroleum, Doha, Qatar. The views, findings, interpretations, and conclusions expressed in this paper do not necessarily reflect the views of Qatar Petroleum.
Umama Ghouri is MBA student at the University of Texas at Arlington, Texas, USA.
Elektor Magazine has been one of the leading sources of information on electronics for engineers, designers, start-ups and companies for 65 years. Our magazine is powered by an active community of electronics engineers – from students to professionals – who are passionate about designing and sharing innovative ideas.
For them, we publish hundreds of items a year, in formats such as articles, videos, webinars, and other learning formats. Our mission is to share knowledge in every possible way and inspire readers with the latest developments within the electrical engineering sector.
Thank you for your vote!
Leave further comments in the fields below.
Thank you for your vote!
If you wish to leave a comment with your rating, please first use the login below. If not, just close this window.


Discussion (0 comments)