
How Is the Internet Doing?
October 1, 2015
on
on
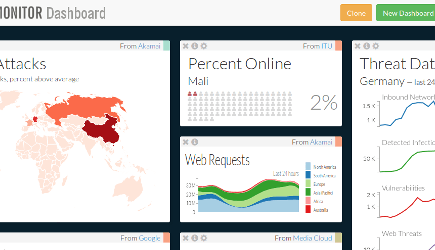
How many people in Mali have access to the internet? How many inbound network attacks have hit Germany in the last 24 hours? Answers to these types of questions can be found on the recently launched Internet Monitor dashboard. It provides a wealth of information about the state of the global Internet in customizable data visualizations.
The Internet Monitor dashboard enables you to create your own dashboard with stats and figures about the internet. You can configure it by selecting widgets that display data on different topics organized by country. The dashboard can be used either with an account or anonymously. Users can build on each other's boards by cloning them and share widgets on the wider web.
The dashboard was launched at the World Economic Forum's Future of the Internet Initiative meeting in Geneva, Switzerland this week. The project is developed and maintained by the Berkman Center for Internet & Society of Harvard University. Part of the data is collected by the Center itself but there are also third-party contributers like Akamai, the International Telecom Union and Wikimedia. The aim of the Internet Monitor is to provide independent information about the many aspects of the internet.
"Internet architecture relies on an extraordinary collective hallucination: there is no central authority or switching station,” said Jonathan Zittrain, Faculty Chair of the Berkman Center. “That has made measurement of even basic facts about the size and scope of the Internet, and the flow of bits within it, difficult. We need those measurements to inform any number of debates about the state and future of the Internet. This project aims to get them.”
The data falls in three broad categories:
Internet Access/Infrastructure provides information about the physical state if the networks including topics like connection speed, percent of people online and costs.
Digital Activity tries to capture how the internet is used. What people are talking about, what information they share and how they build communities. “Ideally, we want to know how well citizens, companies, and public agencies are using the Internet for social, economic, and political ends, and to what extent this contributes to human development and wellbeing”, the project's creators write. “In many ways, it is the most challenging category to conceptualize and to measure.”
Online Content Controls monitor how the internet is regulated and controlled by both state and non-state agents such as companies. This category includes widgets about number of take-down requests, network attacks and spam volumes.
The dashboard is real easy to use as this video shows.
Read full article
Hide full article
Discussion (0 comments)