
MicroPython for the ESP32 and Friends (Part 2): Control Matrix Displays
on
The mini display from the first article was more suitable for smaller devices. In this article about MicroPython for the ESP32, we will show how to realize a large area display with Python knowledge. The means of choice in this case are LED matrix elements with 8 x 8 = 64 individual LEDs each. By stringing together several units, displays of almost unlimited size can be built. These can be used, for example, as “live tickers” for stock market prices or as displays for scores on the sports field at home. With a few Python instructions, large time or temperature displays can be created, which can be used very effectively for advertising purposes on many occasions.
Dot-Matrix Displays
Dot matrix displays allow the output of any symbols and simple graphics in addition to the display of digits and letters. This makes them superior to classic seven-segment displays, which only allow the output of digits from 0 to 9. In addition, seven-segment displays are limited to the sizes once specified. Dot matrices, on the other hand, can be scaled as desired.
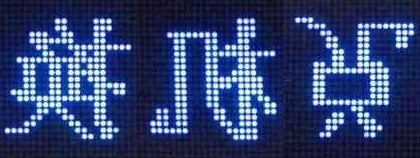
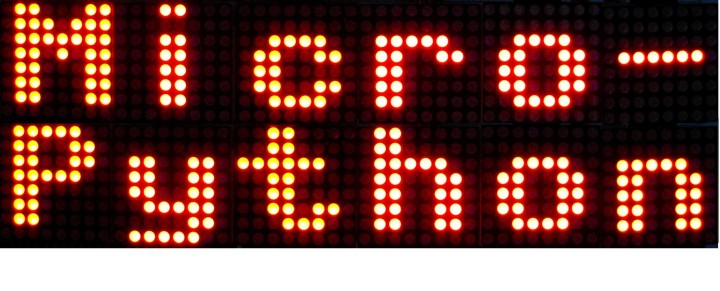
In addition, much greater brightness can be achieved compared to OLED displays. Furthermore, display areas of several meters in length and width can be achieved with LED matrices. This display variant is therefore also frequently used for large-area display or advertising boards in busy squares, train stations or airports, on public buses and trains, etc. In the stock exchange halls of the world, they display shows prices as so-called “live tickers.” Incidentally, dot matrices are particularly popular in the Asian region because they can be used to display Far Eastern characters without any problems, as Figure 1 shows.
Control
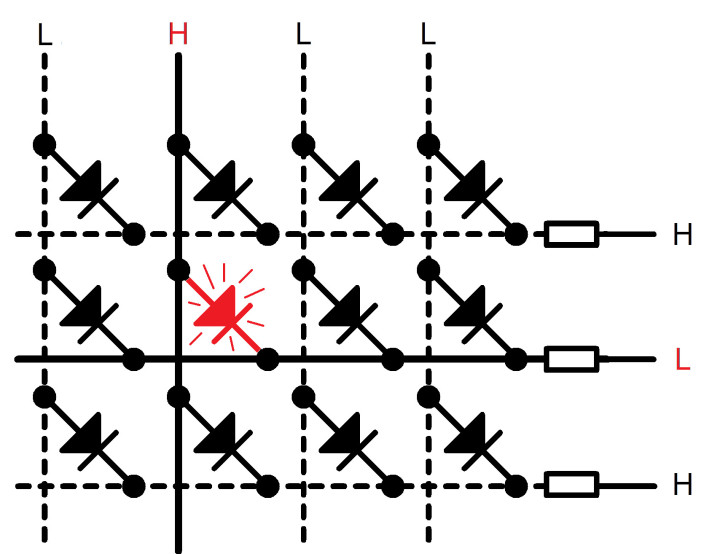
LED matrices with 5 x 7 = 35 LEDs are widely used. However, a wide variety of other designs are also available. Elements with 8 x 8 LEDs are frequently encountered. The direct control of 8 x 8 points would require 65 lines, because 64 anode connections and a common cathode would have to be connected. With a matrix, you can get by with far fewer connections. Here 8 LEDs are connected together in one column and one row. Thus, only 8 + 8 = 16 connections are required. Figure 2 shows the principle for a 3 x 4 matrix. Instead of 13 connections for individual control of the LEDs, only 7 connections are required here. For example, to activate the second LED in the second row in a matrix, all row connections except the second one must be set to HIGH. The second connection, on the other hand, must carry GND potential. For the columns, only the second column may have a high potential.
The direct control of point matrices ties up a large part of the controller’s resources. If sensor values are also to be recorded or actuators controlled, even a powerful ESP32 controller quickly reaches its limits. The control of larger displays with a hundred or more LEDs would also quickly become a problem — on the one hand because of the required computing power, on the other hand because of the limited number of available pins on a controller. In addition, the relatively low execution speed of Python code would also have a negative effect here.
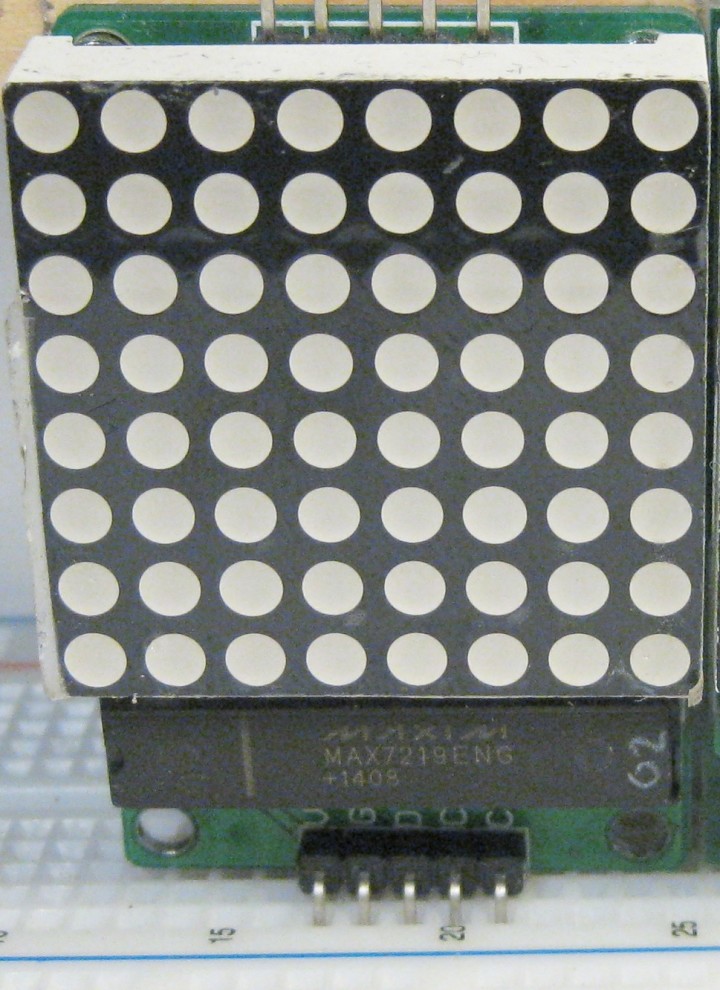
It is therefore advisable to use low-cost display drivers, such as the MAX7219. These devices have an SPI-compatible interface and can thus drive displays with up to 8 x 8 = 64 matrix elements with just three digital pins. The Serial Peripheral Interface (SPI) has found widespread use and is frequently employed in consumer electronics in particular. The bus system and especially its use under MicroPython are described in detail in an Elektor book by the author.
The drivers are available together with the actual matrix element as complete modules. Figure 3 shows an example.
The connection of the driver modules to the ESP32 is very simple. Only the three SPI pins have to be connected to the controller board:
MAX7219_data (DIN) Port D02
MAX7219_load (CS) Port D05
MAX7219_clock (CLK) Port D04
MAX7219_GND ESP32 GND
Due to the relatively high power consumption, it is recommended to provide the power supply externally. It should be noted that the supply voltage of the modules should be approximately 3.3 to 4 V to ensure compatibility with the ESP32. In this way, the modules still receive the minimum permissible supply voltage according to the datasheet on the one hand. On the other hand, an overload of the controller inputs is avoided. Alternatively, a bidirectional 3.3/5 V level converter can also be used.
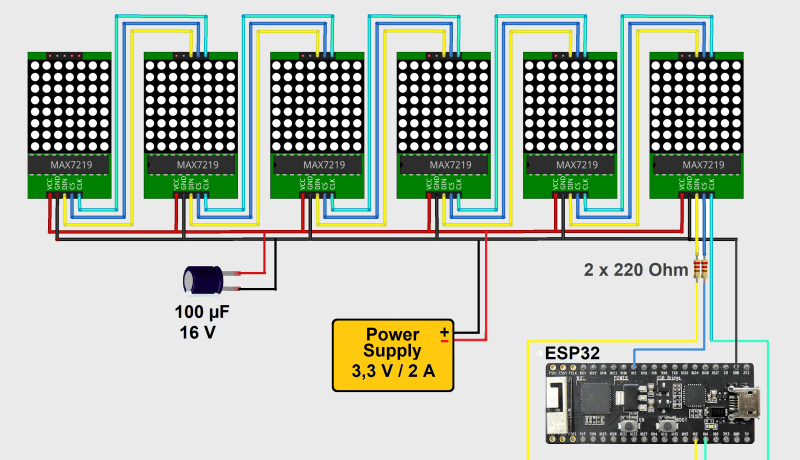
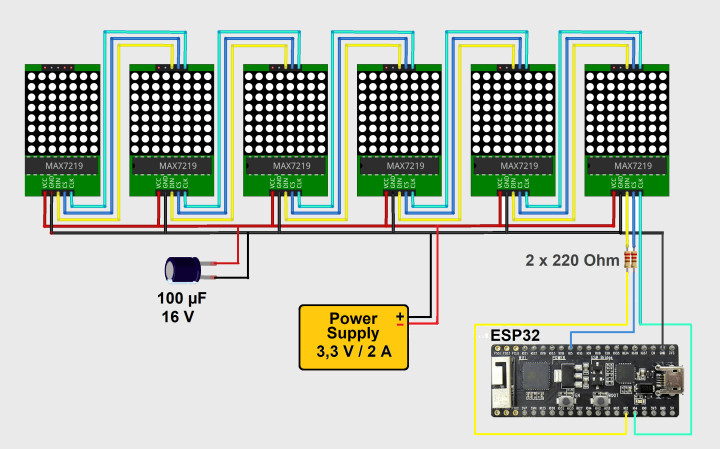
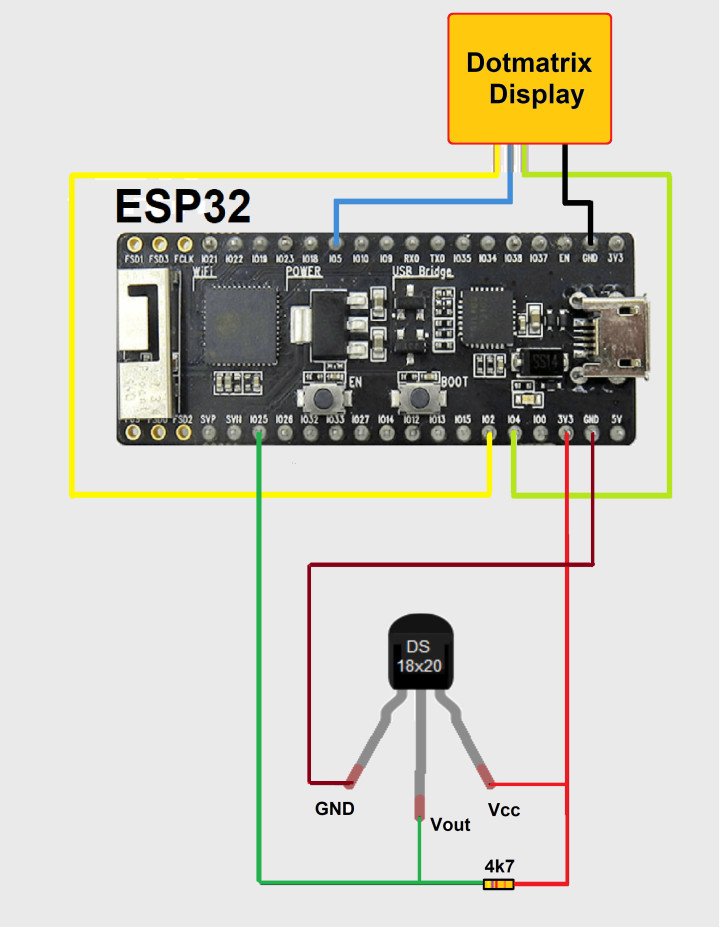
In addition, sufficient blocking capacitors must be provided. Low-resistance VCC and ground lines are also essential. If these precautions are taken into account, displays of almost any size can be built. The controller is hardly loaded anymore, because only single commands have to be sent via the SPI bus. In addition, sufficient pins remain free to operate external sensors or other peripherals. The realization of large-area displays, for example for advertising purposes or sporting events, is thus no longer an obstacle. Figure 4 shows the complete circuit diagram for setting up a six-digit matrix display with an ESP32 controller module.
Success with the Right Library
A link for a suitable Python library for controlling the Maxim ICs can be found in the download package. After loading the driver file Max7219.py on the controller, the following instructions are available:
spi = SPI(1, baudrate=10000000, polarity=1, phase=0, sck=Pin(CLK), mosi=Pin(DIN))
ss = Pin(CS, Pin.OUT)
For the above pin assignment is:
CLK = 4
DIN = 2
CS = 5
to set. Then a display object can be created:
display = max7219.Matrix8x8(spi, ss, MN)
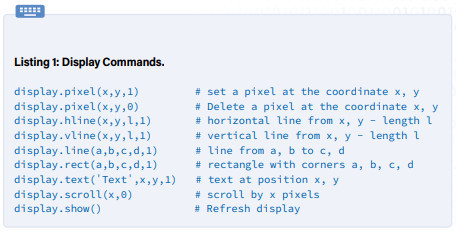
where MN is the number of matrix elements used. Subsequently, texts and graphics can be designed with the commands in Listing 1. This makes it possible to create effective advertisements that are easy to read even from several meters away.
LED Matrix in Action
The following code shows an application example for a display with six 8 x 8 matrix elements:
# LED_matrix_test.py
import max7219
from machine import Pin, SPI
spi = SPI(1, baudrate=10000000, polarity=1, phase=0, sck=pin(4), mosi=pin(2))
ss = Pin(5, Pin.OUT)
display = max7219.Matrix8x8(spi, ss, 6)
display.text('Python',0,0,1)
display.show()
After loading the program to the ESP controller, the text is shown on the display (Figure 5).
The display can be easily extended by further matrix modules. Figure 6 shows an array with 12 elements. However, not only static displays and texts can be displayed. Moving graphics can also be implemented in Python without any problems. The next section shows a corresponding example.
Tickers and Stock Tickers
The scroll function can be used to create tickers and the like. This makes it possible to output longer texts even on small or short displays. The program in Listing 2 scrolls the text “Python” from right to left across a dot-matrix display.
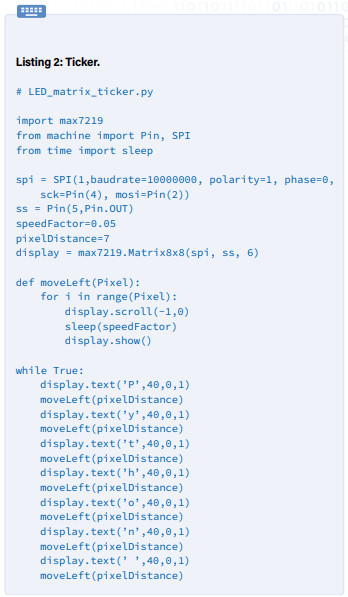
The individual letters are thereby assigned via
display.text('...',40,0,1)
and created at the right edge of the display. Then these are moved to the left by the pixelDistance value via the moveLeft function:
for i in range(8):
display.scroll(-1,0)
sleep(speedFactor)
The run speed can be changed via the speedFactor value. The display can be seen live in action in a YouTube video.
Temperature Display in Large Format
Many pharmacies, banks and retailers try to attract the attention of potential customers by advertising with large temperature or time displays. Such displays are also eye-catchers at sporting events, trade fairs, exhibitions and for FabLabs. To realize a temperature display, for example, you only need to add a corresponding sensor to the setup presented above. A particularly suitable variant here is the DS18x20 from Maxim Integrated (formerly Dallas). With the appropriate Python library, the sensor can be read out without any problems.
These sensors communicate via the 1-Wire bus and thus occupy only a single I/O pin of the ESP32. Furthermore, a ready-to-use Python library is available for this sensor series. In addition to the sensor itself, only a 4.7 kΩ pull-up resistor is required. When using the ESP32 internal pull-up, even this can be omitted. The sensor has the following features:
- Supply voltage: 3.0 V to 5.5 V
- Temperature range: - 55 °C to +125°C
- Measuring accuracy: ±0.5°C (-10°C to +85°C)
- Resolution: 9-bit, corresponding to approx. 1/10 °C
- Measuring period duration: 750 ms (max.)
Not only a single sensor per pin can be evaluated via 1-Wire bus. The special protocol of the 1-Wire bus system allows almost any number of temperature sensors to be queried in parallel via a single controller pin. In the following, however, only a single sensor is used.
Figure 7 shows the connection of the DS18x20 to the ESP32.
An evaluation program for the DS18x20 displays the recorded temperature values on the console:
# DS18x20_TempSens_demo.py
from machine import pin
import onewire
import ds18x20
import time
ow = onewire.OneWire(Pin(25)) # init one wire bus
ow.scan()
ds=ds18x20.DS18X20(ow) # create ds18x20 object
while True:
units=ds.scan() # scan for ds18x20 units
ds.convert_temp() # convert temperature
for unit in units:
print(ds.read_temp(unit)) #display
time.sleep(1)
print()
The modules for reading the sensor are again available by default in the MicroPython firmware.
The extension of the program to the LED matrix display is done with a few lines, see Listing 3.
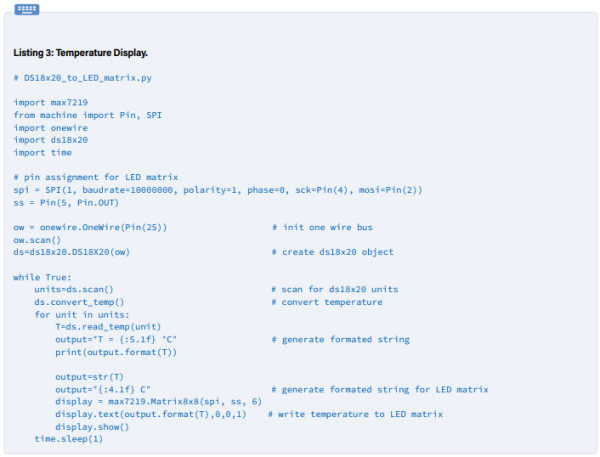
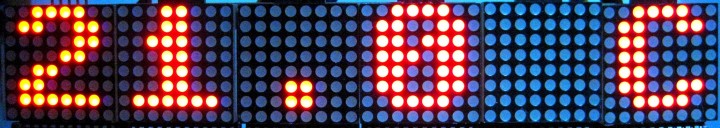
Figure 8 shows the result. Further details on the connection of various sensors for light intensity, humidity or magnetic fields, among others, can be found in the book.
Animated Graphics
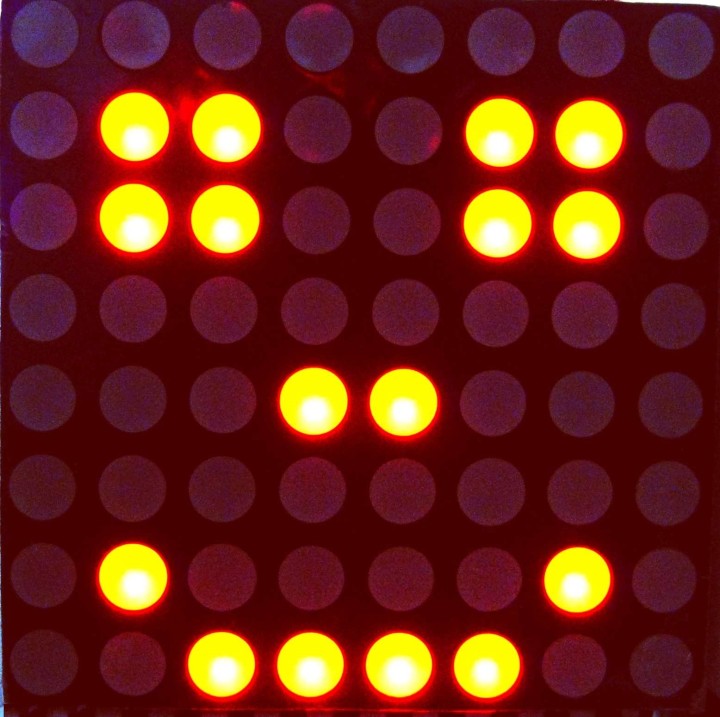
Besides letters and numeric data, graphics and even animations can be presented on the LED matrix. The program in Listing 4 conjures up any pixel graphic on the display.
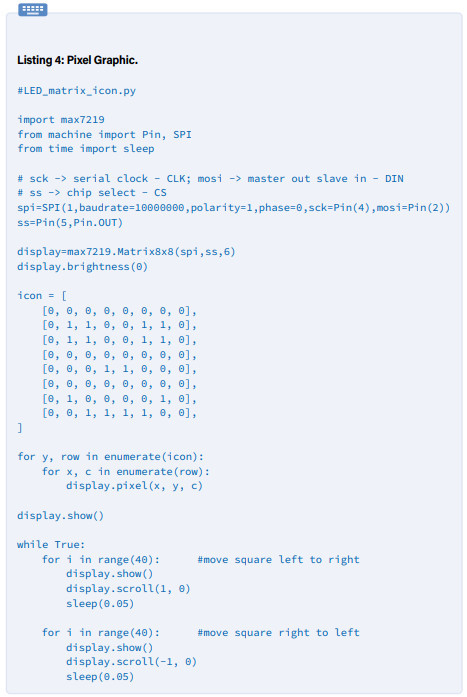
The graphic is generated via the bitmap icon. Points that are to light up later are to be marked with a “1”. Dark points receive a “0”:
[0, 0, 0, 0, 0, 0, 0, 0],
[0, 1, 1, 0, 0, 1, 1, 0],
[0, 1, 1, 0, 0, 1, 1, 0],
[0, 0, 0, 0, 0, 0, 0, 0],
[0, 0, 0, 1, 1, 0, 0, 0],
[0, 0, 0, 0, 0, 0, 0, 0],
[0, 1, 0, 0, 0, 0, 1, 0],
[0, 0, 1, 1, 1, 1, 0, 0],
In this way, any icons can be created. The enumerate function converts the bitmap into a displayable graphic:
for y, row in enumerate(icon):
for x, c in enumerate(row):
display.pixel(x, y, c)
This results in Figure 9 on the LED matrix. The scroll function in the main loop can then be used to move the image generated in this way across the display unit (see also in the YouTube video).
Summary and Outlook
After the elementary commands were introduced in the first article of the series, these could now be used in various practical applications in the second part. Powerful libraries make it possible to implement impressive projects with just a few lines of programming. This confirms the remarkable power of MicroPython also for controller applications. Further information and many practical projects can be found in the book MicroPython for Microcontrollers. Among other things, the control of servos, wireless data transmission via RFID, the MQTT protocol and the transmission of sensor values to the Internet are also covered in detail there.
In addition, the combination of Python with the rapidly growing field of machine learning and artificial intelligence will enable applications in the near future that were previously unthinkable. New controller generations such as the Kendryte K210, for example, already allow the direct evaluation of audio and camera signals. Together with Python-based image processing algorithms, this opens up a wide range of future-oriented options for developers.
Questions or Comments About this article or ESP32?
If you have technical questions or comments about this article, you can email us at editor@elektor.com.
More Elektor on MicroPython and ESP32
Take out an Elektor membership today and never miss an article, project, or tutorial.
Discussion (0 comments)