
Portable, Stand-Alone Air Quality Display for 2.5 µm Particles
on
At this time of the COVID-19 pandemic, you would almost forget that there are other reasons to wear a face mask. And that there are places where this has been advisable, if not necessary, for much longer. Living in Asia in large cities, outdoor sports are often problematic due to air pollution, especially for 2.5 µm particles, also called PM2.5. High concentrations of these small particles in ambient air can be harmful and even dangerous to your health. The PM2.5 display presented in this article can be used to monitor air quality.
I had already made a PM2.5 display, rechargeable with a solar panel but that was not suitable for indoor use. I had also designed an ESP32-based version, where I tested different sensors whose data was sent via WiFi to Thingspeak, but this was not portable. The main idea of this project is to design a device that is as compact as possible, battery powered, with an autonomy of several weeks and can permanently display the PM2.5 index of the ambient air. This portable display can be positioned outdoors, for example, with a suction cup stuck on a window so the PM2.5 level is permanently visible from inside. But of course, you can also use it indoors.
Design Considerations
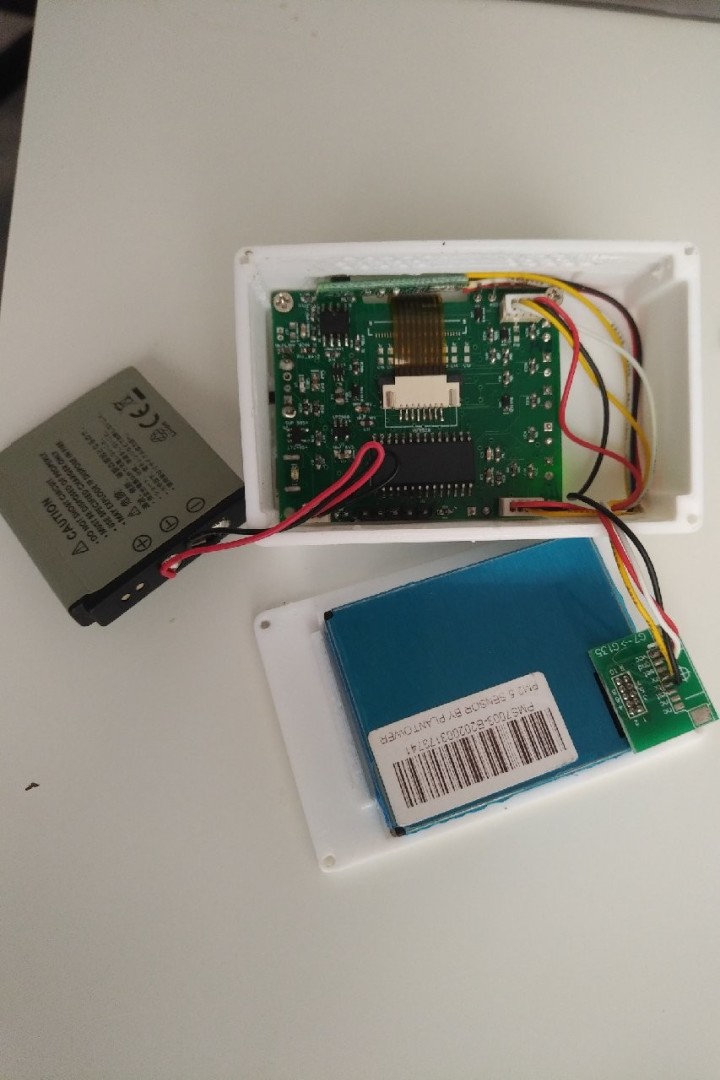
The choice of the dust particle sensor is very important. In a previous project, I had tested several types of sensors, like an outdoor version with the Sharp GP2Y10 sensor. However, if we want a compact design, from all these sensors only the Plantower PMS7003 sensor is usable. It has a serial interface for sending measurement data. When you order this sensor, make sure that you buy it including the matching connector! As the sensor needs up to 100 mA at 5 V (mainly due to its internal mini fan), it cannot operate continuously, batteries will be drained in no time. The supply voltage is provided by a lithium battery, therefore a DC/DC converter (3.8 V to 5 V) with a true shutdown is required.
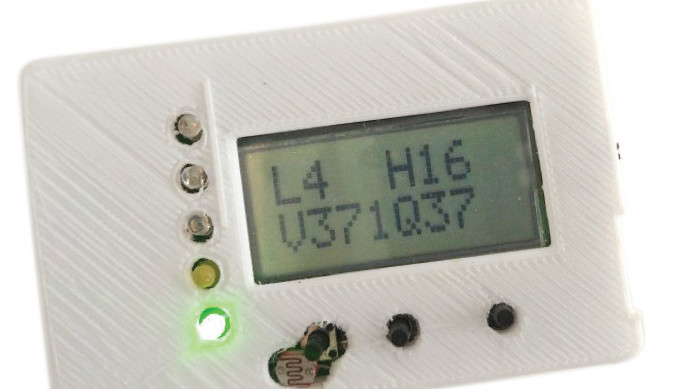
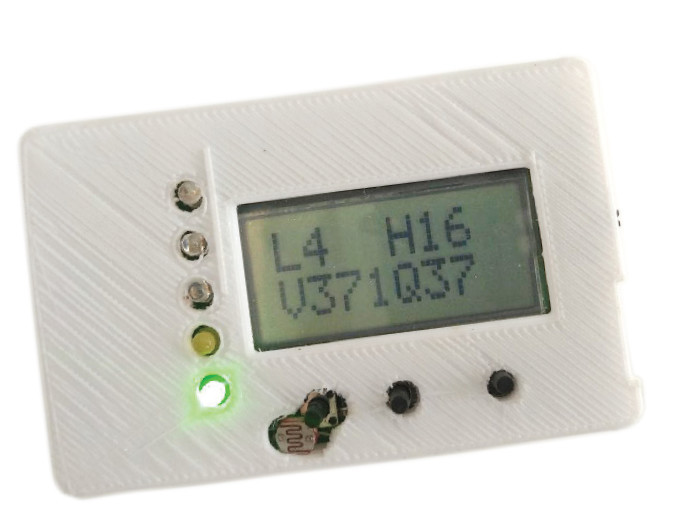
The display I selected is an 8 x 2-line monochrome alphanumeric LCD. It consumes less than 1 mA with permanent display. A colour or OLED display cannot be used due to their high-power consumption, which would seriously affect the autonomy of the project. For a quick view of the PM2.5 measurement, an LED bar graph is added. The level is represented by a lit LED, six ranges of PM2.5 levels with five LEDs according to the colors shown in Table 1 with the highest level signaled with both the red and blue LED lit (maroon in the table). All LEDs are low power, e.g. Kingbright WP71xx series which have a forward current of 2 mA. A low power and high brightness version can be useful if the equipment is placed outside.

Temperature and humidity display are also added (optional), using an I2C SHT20/SHT21 sensor. The software also supports the DS1820 1-Wire temperature sensor, but this has not been tested in this application.
The heart of the setup is a Microchip Technology PIC18F2520 with a MAX931 for battery voltage monitoring and an LTC4054 lithium battery charger as peripherals. The overall power consumption of the detector depends mainly on the interval between the measurements. According to the PMS7003 specification, it must be powered on for 30 seconds before the first reliable measurement can be performed. By default, the interval is set to 20 minutes, but it can be changed via the menu. With this default setting and a 1000 mAh battery, this detector can run two weeks without recharging. The size of the battery depends on the enclosure. Any lithium, LiPo or prismatic battery can be used. For this project, having developed a compact case, the battery will be as big as possible (in terms of volume) in the remaining space. I found an 1100 mAh battery that just fits.
Features of the PM2.5 Display
Measurement of the 2.5 µm particle level is made at regular intervals. This period can be changed in the menu between 10 minutes and 60 minutes, with 20 minutes being a good compromise between measurement accuracy and power consumption. Every hour, the program calculates the average of the last measurements, only one average is kept and stored in a table. There are several ways to calculate the air quality level (associated with PM2.5). In this project, two methods are available:
- IQA: arithmetic mean running over 24 hours
- New AQI version: 12-hour moving weighted average (here called NQI). The most recent measurement has a greater weight than the one made 11 hours ago.
By default, the NQI version is displayed. The particle measurement level on the LED bar can show:
- Most recent measurement (Last)
- Last hourly average (Hour)
- IQA or NQI
The LEDs can be switched off during the night to save batteries. An LDR measures the ambient brightness and changes mode (day/night).
An interesting option to display the instant PM2.5 level in real time. The sensor is permanently active, and the displayed value refreshes every second. However, this option consumes a lot of power and drains the battery in short time.
Other values that can be displayed:
- Temperature and humidity display
- 3-digit battery voltage display (for example "384" meaning 3.84 V)
- When the battery voltage is low, the LED display is flashing, indicating that recharging is necessary.
A connection is provided for optional battery charging with a 5V solar cell for outdoor use. The menu settings are saved in the internal EEPROM of the microcontroller. All other values, tables and variables will be reset when the unit is powered off or restarted.
Air Quality Index Calculation
There are many methods used to calculate the air quality index. In this project, two versions are implemented. The first is averaged over the last 24 hours using the calculation method of the USA, details on this method can be found here. The drawback of this method is that it uses a moving average over 24 hours. Therefore, the value that is displayed is influenced by relatively old air quality levels. For this reason, a new calculation (NowCast) is being used that makes a weighted average. The measurement of the past hour has a greater weight in the final calculation than that of 11 hours ago. It is also a sliding average but over 12 hours. It is called here NQI (New Quality Index), and it keeps the same limits as the version above. The link explaining this method in detail is given in [2]. To keep it simple, the index value of the previous hour has a weight of 50 %, that of hour -2 has a weight of 25 %, that of hour -3 has a weight of 12.5 %, etc. A practical implementation of the algorithm is discussed in this link.
The Hardware
The schematic in Figure 1 shows the hardware of this air quality display.

The DC/DC boost converter for the PMS7003 sensor is a LT3525ESC6-5 (U6). It is a so-called "true shutdown" step-up converter. Most DC/DC boost converters have a shutdown function that will just stop the transistor switching in the choke circuit. But then the output voltage still follows the input through the diode-choke circuit and it still consumes power. True shutdown circuits really shut down the converter and no current can flow to the output. The only real problem with this IC is to solder it. It's really small, solder paste and a hot air soldering station are recommended.
The LP2980 3.3 V (U7) regulator is controlled by U1, a MAX931 comparator with hysteresis. It switches the regulator off if the battery voltage drops below 3.2 V and can only be reactivated if this voltage rises above 3.8 V. This function, not necessarily useful in normal mode, is necessary when using a solar panel for recharging. The MAX931 will also block the DC/DC converter via diode D5 to prevent unintentional starts in low battery conditions.
The serial link is shared between the external connector J8 (for tracking and downloading) and the PMS7003 (connected to J1). The Tx signal from the microcontroller is connected to both connectors. The Rx signal is sent via a D2-D12 diode-OR. As the software does not send commands to the PMS in the current version of the firmware, the resistor R16 (0 Ω) is not mounted.
For the SHT20/21 sensor, the I2C connection is made by software simulation, via portB.0, portB.1, without using the internal I2C of the PIC (which is used for the display). The LCD that is used here, an Eastrising Serial COG 8x2 LCD Module I2C Character Display, has an I2C interface and is connected via U3.
The charger for the lithium battery is an LTC4054 (or equivalent EUP8054, U4). It can be powered either via USB (J2) or via an external solar panel connected to J4. The current is limited by the two resistors R19-R20 to 400 mA. LED D4 indicates that the battery is being charged, it is placed near the USB connector. Connector J4 is used to connect a 5 V solar panel, which will recharge the battery via Schottky diode D7.
The five bar graph LEDs (D8 to D11 and D13) are controlled by the PIC-controller. The current limiting resistor of each LED depends on the type of LED used (low power or not) and on the forward voltage of each colour LED. LED D1 (red) lights when the DC/DC converter is ON and therefore the particle sensor is switched on.
For the display, capacitors C10 and C11 can be between 1 µF and 2.2 µF, 10 V version. The display backlight is not used (and can be removed before mounting). It is attached to the printed circuit board with double-sided adhesive tape. It is recommended to buy the display with its connector.
The brightness for the day/night mode is detected by an LDR (C1) placed on the front panel. It is connected to analog input AN0 of the microcontroller.
Assembling the PCB
The schematic and PCB were designed using Novarm’s DipTrace CAD software, the design files can be downloaded from the Elektor Labs project page. All components except for the LEDs are SMDs. The most difficult part to solder is the DC/DC converter, I used solder paste and a hot air soldering station for this. Given the compactness of the case, it is difficult to mount standard connectors to connect the 2 sensors. It is therefore preferable to solder the wires directly to the circuit. Only the battery and the display use a connector.
There are two solutions for programming the microcontroller. Either connect a PicKit3 to J7, or via the serial connector shared with the PMS7003 sensor. In this case, the microcontroller must be programmed with a bootloader before soldering and the PMS7003 must be disconnected each time the uC is reprogrammed. Personally, I always use a bootloader called Tiny bootloader, which can be found here. It is necessary that the version embedded in the PIC has the right value for the watchdog (here 256 ms) and so the source must be recompiled with it. The .asm and .hex of this bootloader for the PIC18F2520 is also part of the software download on the Elektor Labs project page.
Software
The software is developed in C, with an older version of the MikroC compiler. It can be ported to the newer version, MikroC Pro, but I have not tried it. Source and HEX-file can be downloaded from this project’s page on Elektor Labs. The firmware is quite simple:
- Init
- Infinite loop with button test
- Display of the different screens, the level of the LEDs (depending on the reading of the brightness for day/night switching)
- Every xx minutes, switch on the 5 V DC/DC converter for the particle sensor. 30 seconds later, the PM2.5 value is read and the DC/DC converter is switched off.
- Every hour, calculation of the average value
- Storage of this value in a 24-position moving average table (for 24 hours)
- Calculation of the IQA (moving 24-hour average) or NQI (moving 12-hour weighted average)
The main loop of the software is terminated by a “sleep” instruction. The processor wakes up when the next watchdog is triggered, the watchdog interval must be set to 256 ms (in the case of the PIC18F2520 this must be done when programming the microcontroller). This interval is short enough not to miss key presses. A longer time would be better as far as power consumption is concerned, but then it would then be possible to miss button presses. The software also works without the temperature/humidity sensor attached, but of course the display will show invalid values for temperature and humidity then.
Enclosure
The case was designed in ThinkerCad and printed on a 3D printer. It is quite simple, with openings for the SHT sensor on the top as well as for the PMS7003 sensor, one for the air inlet, one for the outlet. The most recent version of the design can be downloaded [4]. A bracket for a solar cell has also been developed. It is attached to the back of the enclosure with small hooks.
The compact, battery-powered hardware is working great, but this design can always be enhanced or improved. For example, the schematic and PCB already have a connector (J6) for a low power 128 x 64 pixel graphic LCD, but this is not tested and not supported in the current version of the firmware, so J6 and all capacitors close to it in the schematic can be omitted.
Unfortunately, air pollution is still a growing problem, not only in large cities in the Far East. It is good to have a PM2.5-display at hand to monitor air quality, but to be honest: it’s actually very bad that we need it.

Questions or Comments?
Do you have questions or comments about his article? Email the author at laurent.elektor@gmail.com or contact Elektor at editor@elektor.com.
Discussion (3 comments)