

Tracing the Cause of Software Bugs Wirelessly: Circular Buffer and Webserver on the ESP32
on
Software development for microcontrollers is often challenging. With few exceptions, microcontrollers offer some sort of debugging solution that can start and stop the processor and allows variable and register contents to be examined. This helps in determining the cause of an issue. However, many maker boards, such as Arduino Uno or BBC micro:bit, have no such support natively, leaving the developer to edit and download code repeatedly until the source of the issue is found.
But debuggers are not always the panacea they seem to be. When developing real-time code for Ethernet, Wi-Fi, or USB, or in applications such as motor control, you cannot simply halt the microcontroller mid-flow. This results in a break in communication and can even cause damage to power devices, should a MOSFET be caught in its on-state.
Thanks to the ease with which a serial output can be initiated on maker boards, most developers add some text-based debug output to their code by sending messages to a terminal on a PC via USB. When analyzing the output after a test run, the developer can trace the path taken by the code, hence why this method of debugging code is known as ‘software trace.’ This also allows debugging of applications that cannot be stopped during operation.
Thousands of innovators use the online Elektor Labs platform to share electronics projects and find new ideas. Join them on Elektor Labs! Present your electronics projects. Submit your articles to Elektor's editors. Pitch your products for the Elektor Store. All you need is a free Elektor ID.
The Project
Elektor Labs regular Laurent Labbe often uses the serial interface for tracing embedded code execution but doesn’t always have a spare laptop to log the messages. This got him thinking about whether there was an alternative approach. Armed with an ESP32, an OLED display, and a 3D printer, he came up with the “Wireless trace for debug” project.
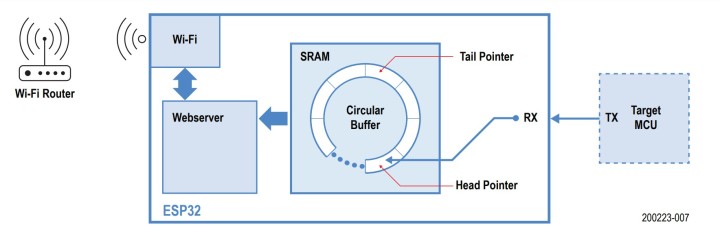
The approach uses an ESP32 as a buffer for debug messages, connected to the target controller by a serial interface; the buffer is made accessible by Wi-Fi and a webserver (Figure 1).
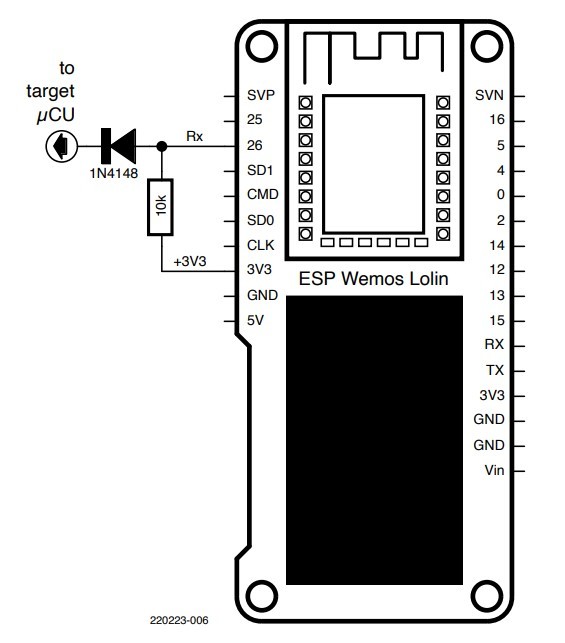
The massive amount of SRAM on the ESP32 allows to implement a giant circular buffer. Laurent’s projects typically use a low baud rate of 9600, but this can be modified. Every time a character is received, it is pushed into the head of the circular buffer. The buffer is 65530 bytes (unsigned char) in size, so there is plenty of space for gathering trace messages. Serial1 is initialized for data collection using pins 25 and 26 (TX and RX, respectively), although only the RX pin is required. Because the ESP32 is a 3.3 V device, Laurent included a resistor/diode circuit to allow 5.0 V microcontrollers to be connected to the serial interface (Figure 2).
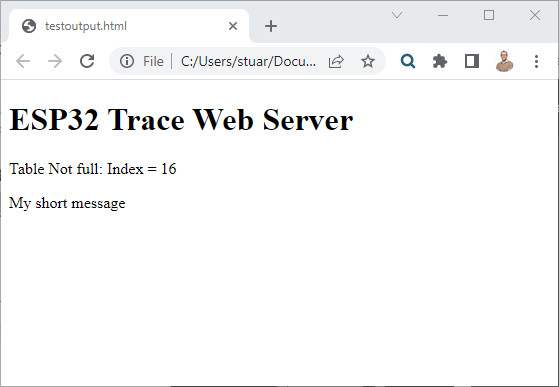
As said, the project uses the ESP32’s Wi-Fi capability, which is where this design shows its uniqueness. After registering with the network as defined in the code, any local laptop or mobile device can access a webpage offered by the ESP32. The ESP32 then serves a simple page that includes the current contents of the circular buffer (Figure 3).
There are a few other cool features built into the code too. For example, a second SSID and password for an alternate Wi-Fi router are supported. Should the first link fail for any reason, the ESP32 automatically attempts to connect to the backup. With potentially hours or days of data stored on the device, this offers more robustness for retrieving the trace messages. The web server uses port 80 by default, but an alternative port can be defined at initialization.
The circular buffer also implements wrap-around. Thus, should the buffer be filled completely, new incoming messages overwrite the oldest data. For clarity, the webpage includes an appropriate message before displaying the circular buffer’s content from oldest to newest.
The ESP32 also outputs messages via the Serial interface (over USB), enabling this project’s code to be debugged. Debug messages received via Serial1 are output to Serial for immediate visibility. Any data received on the Serial interface is also inserted into the circular buffer.
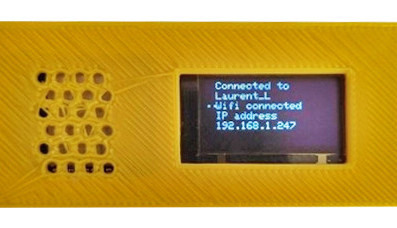
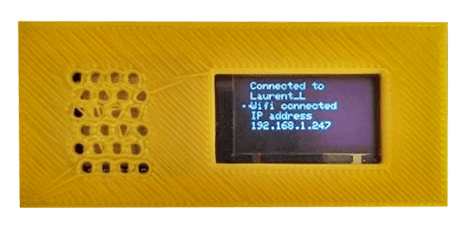
Information on the IP address and other relevant details are output to an I2C-based OLED display connected to pins 4 and 5. The display used is the SSD1306 from Adafruit together with their driver and GFX graphics libraries.
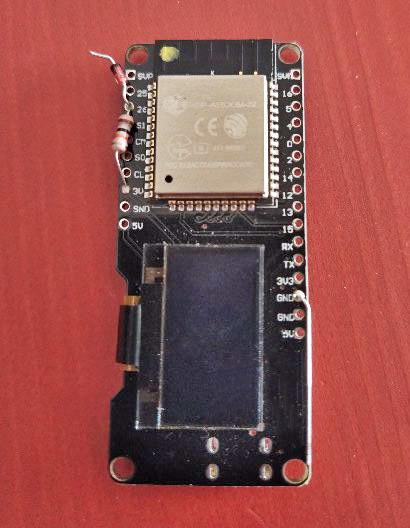
Laurent used a WeMos Lolin32 OLED (Figure 4, the board is based on the ESP32-WROOM-32 module with added circuitry) to implement the USB-to-UART interface and support for connecting and charging a LiIon/LiPo battery. Together with his 3D-printed case, for which a CAD file is provided, this wireless debug trace tool can be deployed almost anywhere to collect data from your target autonomously (Figure 5).
The beauty of this project is the combination of its simplicity and extensibility. The code’s functionality is clear, making it easy for experienced developers to extend and modify this project. For example, extending the available SRAM using external devices wouldn’t be difficult, and you could even store the trace messages on an SD card. The serial interface speeds for logging data can also be adapted, or data from an I2C or SPI interface could be collected instead. Finally, should your messages require a little color or formatting, you could insert appropriate HTML or CSS during web page generation.
Questions on Debugging or Software?
Do you have technical questions or comments about this article? Email Elektor at editor@elektor.com.
Discussion (0 comments)