The Raspberry Pi Debug Probe is a USB-to-debugging kit that provides all the necessary hardware and cables to facilitate easy, solderless, plug-and-play debugging. It includes an Arm Serial Wire Debug (SWD) interface and a standard UART interface.
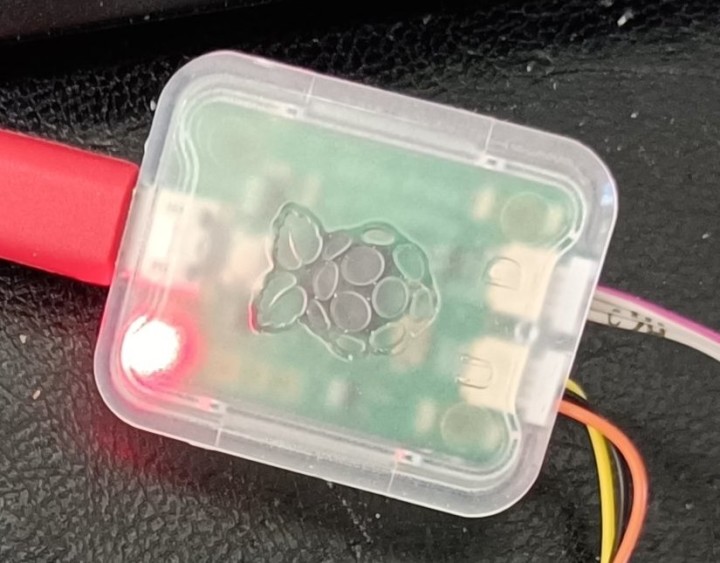
The Raspberry Pi Debug Probe is a little pod (measuring 37 mm by 31 mm by 10 mm) featuring a USB UART port and a Serial Wire Debug (SWD) interface for debugging RP2040 applications. Both interfaces utilize the tiny 3-pin Raspberry Pi debug connector. One port is marked ‘U’, the other ‘D’. The pod is housed in a two-shell translucent plastic enclosure that opens easily in case you need to access the insides to reprogram it or so.
A Complete Debug Hardware Solution for the RP2040
The Raspberry Pi Debug Probe comes with four cables: a raspberry-colored USB cable (1 m) and three debug cables, each about 16 cm long. The debug cables all have a “JST”-type debug connector on one end. On the other end, we find either another “JST” connector, three male breadboard jumper wires and three female breadboard jumper wires. Together these cables allow for an easy connection of the pod to the target processor. Note that I put quote marks around JST as JST is the name of a connector manufacturer; it does not designate a particular type of connector.
If, for some reason, none of the included cables suits your application, know that you can also solder wires to the bottom of the debug probe’s circuit board as it has solder pads for this.
Using the Raspberry Pi Debug Probe
To use the debug probe you need OpenOCD and GDB. Instructions for installing these tools on Linux, Raspberry Pi OS, macOS and Windows are available on the Raspberry Pi website. I took the easiest route (for me), which is using the Windows installer (Raspberry Pi Pico SDK v1.5.0) that includes everything you need. As a matter of fact, manually installing GDB on Windows is not recommended anyway. Larger than life: the Debug Probe only measures 37 mm by 31 mm by 10 mm.
After installing the Pico SDK connecting the debug probe to my computer resulted in a CMSIS-DAP device being configured and then I found a new USB Serial Device as COM11.
Unfortunately, this is where the online Windows documentation stops. However, a ReadMe file had been opened by the SDK installer, which contains the instructions for getting started on Windows. The instructions refer to the Picoprobe, which is a Raspberry Pi Pico programmed as a debugger. As this is the same thing as the Debug Probe, these instructions work fine. If you ever close this file, intentionally or accidentally, it lives at c:\Program Files\Raspberry Pi\Pico SDK v1.5.0\.
Subscribe
Tag alert: Subscribe to the tag Raspberry Pi and you will receive an e-mail as soon as a new item about it is published on our website!
Plug ‘n’ Play
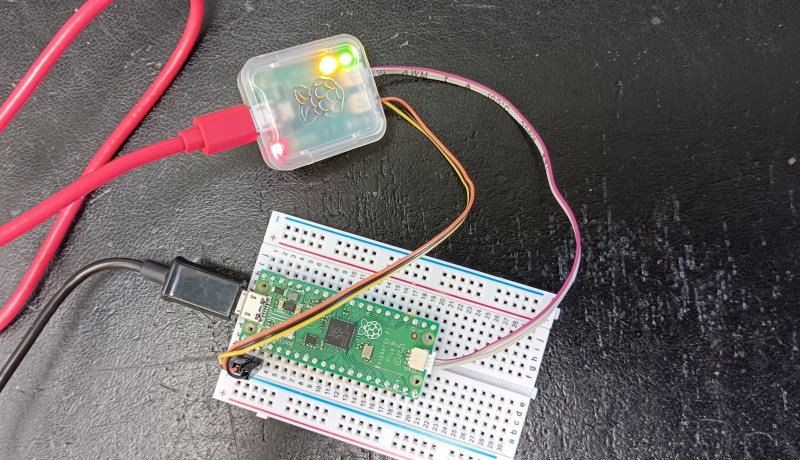
I connected a Pico H board to the Debug Probe, exactly as shown on the Debug Probe webpage. Then, in Visual Code I compiled the hello_uart example and pressed the Run and Debug button (in the menu bar on the left) followed by a click on the small 'play' icon at the top of the debug window (you can also press F5). The program’s source opens, and you are ready to go. Use F10 and F11 to step through the code. Nothing to configure, that’s how I like my debuggers.
Stepping through the source code of a simple RP2040 application with the Debug Probe.
Built-in Serial Port
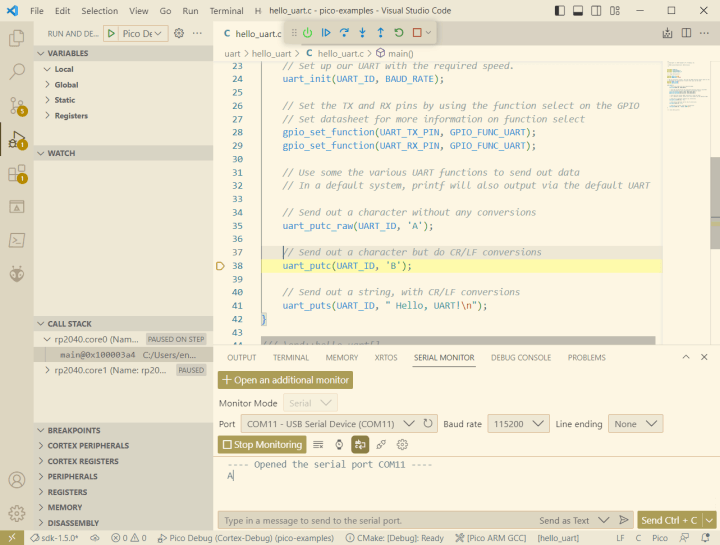
In the lower pane of Visual Code, you can open the Serial Monitor to visualize the output of the hello_uart example. This works perfectly fine thanks to the debug probe’s UART port. This port is, at least for me, the best feature with its two LEDs that flash for incoming and outgoing data. I am sure that I will be using the pod mainly as a serial converter since my approach to debugging tends to be a serial port.
Conclusion
Basically, the Raspberry Pi Debug Probe is a Pico redesigned as Picoprobe. This may sound a bit negative, but it is, in fact, good news because it means that the Debug Probe works in the same situations as the Picoprobe. The Debug Probe is just a nicer device.
The small dimensions of the pod make it practical to use as it is not easy in the way and does not pull on the target. On the other hand, it is so light that it won’t remain in place. Also, the “JST” connectors are a bit too deep inside the pod, obliging you to pull on the wires to disconnect the cables instead of by grabbing the connector.
Some people find the price of the debug probe too high, but I do not agree. For about €12, you get a neat little tool that saves you the hassle of figuring out how to turn another RP2040 board into a debug probe, supposing that you have a board available for this. As debugging is already something you don’t want to do anyway, why make it more complicated than it needs to be?
Elektor Magazine has been one of the leading sources of information on electronics for engineers, designers, start-ups and companies for 65 years. Our magazine is powered by an active community of electronics engineers – from students to professionals – who are passionate about designing and sharing innovative ideas.
For them, we publish hundreds of items a year, in formats such as articles, videos, webinars, and other learning formats. Our mission is to share knowledge in every possible way and inspire readers with the latest developments within the electrical engineering sector.
Thank you for your vote!
Leave further comments in the fields below.
Thank you for your vote!
If you wish to leave a comment with your rating, please first use the login below. If not, just close this window.

Discussion (0 comments)