
Electricity [Grid] Frequency Meter
An article by Dieter Laues in the February 2012 issue of Elektor inspired me to get my soldering iron out. The article described how by measuring the frequency of the mains electricity supply in any socket, the relative load across the entire electricity network could be determined.
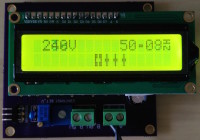
An article by Dieter Laues in the February 2012 issue of Elektor inspired me to get my soldering iron out. The article described how by measuring the frequency of the mains electricity supply in any socket, the relative load across the entire electricity network could be determined. I ordered a pre-programmed processor (of the correct supply frequency) and built a meter for the electrical engineering department of the Further Education College I worked for at the time. When not being used in the classroom I would often switch it on in my workshop and stare at it, fascinated, as the LEDs travelled up and down as the load on the grid exceeded, and fell short of, the available supply. After leaving the College, I was sorry not to be able to monitor this and eventually became determined to build my own version. I decided to use a sixteen pixel by two line LCD display that would show the approximate supply voltage along with the frequency of the supply on the upper line of the LCD and the relative deviation of the frequency away from the nominal supply frequency as a bar graph on the lower line. The bar graph has a resolution of 0.025Hz (25mHz) per segment and indicates a lower than nominal frequency (and increased demand) by illuminating pixels to the left of the centre of the display and a higher than nominal frequency (increased supply) by illuminating pixels to the right of the centre of the display. When the grid is fully balanced and running at the nominal frequency, only the two centre elements of the LCD are lit. With sixteen pixels, each representing 0.025Hz the lowest frequency which can be displayed on the bar graph is the nominal frequency - (eight pixels x 25mHz) = nominal frequency - 200mHz, the highest displayable value being nominal frequency + 200mHz. The software within the program detects for nominal frequencies of either 50Hz or 60Hz and scales the bar graph and frequency display appropriately to suit. Should the frequency drift over or under the 200mHz limit an upwards or downwards arrow is displayed next to the frequency display to indicate that the frequency is beyond the displayable limits of the bar graph. This also would indicate that the supply has exceeded that of the legal limits of the UK supply regulations.
Want to build a project?
Bring your design to life with the Elektor PCB Service, powered by Eurocircuits. Upload the project files and order professionally manufactured PCBs or assembled boards through a proven European production platform.
Supporting KiCad, Eagle, Gerber, and ODB++ formats, the service is suitable for everything from prototypes and validation builds to series production and volume manufacturing.
Made in Europe. Fast. Reliable. Professional.
Updates from the author