
BattLab-One: Measure the Battery Life of IoT Devices
on
Obtaining a consistent measurement of the energy consumed by a device running a microcontroller is not a trivial task. As with any computer chip, power consumption depends heavily on the instantaneous processing load and operational status. It is not only necessary to consider normal operation and standby or deep sleep states, in which the current consumption of common microcontrollers can vary between less than 1 µA and several hundred milliamps (mA). Some peripherals in the device may also only be active at certain times so that current consumption will not be constant. A specialized tool like the Bluebird Labs BattLab-One is very useful in this respect and can take this dynamic behaviour into account to make a reasonably realistic estimate of the operating time of the device when powered by different battery types.
What Is BattLab-One?
In the field of power consumption measurements, a source measure unit (SMU) is a useful tool to have on the workbench. This type of power supply provides power to the device under test (DUT) and also makes accurate measurements of power consumed over defined periods of time. Professional examples of SMUs are manufactured by Keithley. The BattLab-One from Bluebird Labs aims to fulfill a similar function, but for a price of less than €100. The device (including metal enclosure)is available from the Elektor Store.
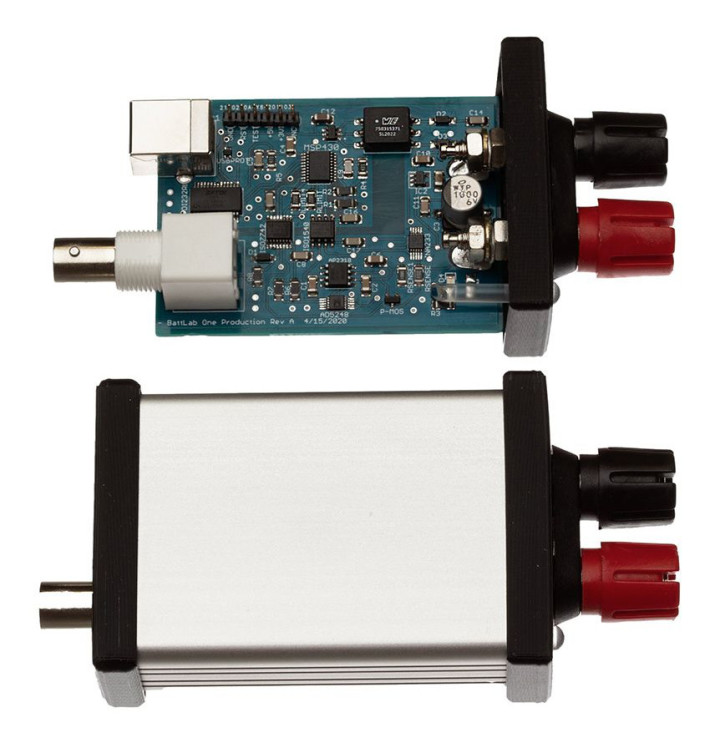
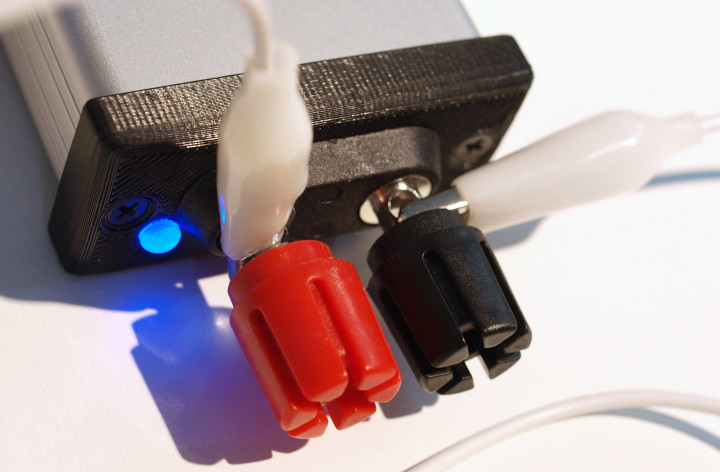
Refer to Figure 1 to see the USB type B socket on the left together with a BNC socket that accepts a trigger input signal. On the right are the two 4-mm sockets from which the DUT can be powered. Figure 2 shows the plastic collars, which can be unscrewed to allow croc clips to be attached to the posts. A closer look at the case end caps shows a surface texture consistent with 3D printing.
BattLab-One is powered from a computer USB port and is able to supply devices with a range of supply voltages from 1.2 to 4.5 V and currents up to a maximum of 450 mA. The discharge profiles of frequently used battery types (such as Li-Ion, LiFePO4, alkaline, NiMh and NiCd technology) are included in the software and used to calculate expected battery life. BattLab-One does not take into account subtleties such as load and battery age related voltage drops. According to the manufacturer, the measuring device offers a basic battery simulation and a current measuring range from 10 µA to 500 mA. A 16-bit ADC sampling at 1 kHz is incorporated into the design to measure current to the DUT.
BattLab-One and Linux
Software for the device was developed by Bluebird Labs using Python. As a first attempt, I was keen to get the system working directly under Ubuntu 20.04 LTS. The software source code is available from GitHub and can be compiled using the usual methods. However, Bluebird Labs has taken a different approach by using pipenv. Anyone who, like me, has only installed the usual venv variant needs to install pipenv. For me the process went as follows:
tamhan@TAMHAN18:~/BattLabonespace/BattLab-One$ sudo apt install pipenv
The first problems arose when setting up the Virtual Environment, as Python version 3.7. is assumed. If, like me, you want to use a newer version (i.e., version 3.8 preinstalled under Ubuntu 20.04 LTS), the following statement will be required:
tamhan@TAMHAN18:~/BattLabonespace/BattLab-One$ which python3
/usr/bin/python3
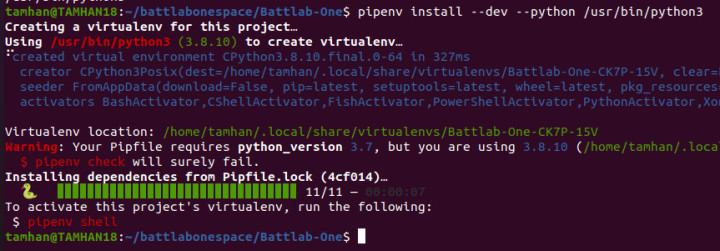
tamhan@TAMHAN18:~/BattLabonespace/BattLab-One$ pipenv install --dev --python /usr/bin/python3
Now let’s consider the process of creating a virtualenv for this project. The software issues warnings (Figure 3) when the commands are entered. The virtual environment is therefore activated according to the following scheme. It will remain active like a normal venv environment until the terminal window is closed:
tamhan@TAMHAN18:~/BattLabonespace/BattLab-One$ pipenv shell
. . .
Execution of the three .py files with the software is now possible using to the following method:
(BattLab-One-CK7P-15V) tamhan@TAMHAN18:~/BattLabonespace/BattLab-One$ python3 BattLab-Release_V1.2.1.py
Traceback (most recent call last):
File "BattLab-Release_V1.2.1.py", line 59, in <module>
import pkg_resources.py2_warn
ModuleNotFoundError: No module named 'pkg_resources.py2_warn'
Unfortunately, Bluebird Labs does not comply with the setup tools specification but explicitly includes a library that is only available in a few versions of the setup tools. The .py file must be edited to remove the following statement:
import pkg_resources.py2_warn
Now the software has a problem with the local paths:
(BattLab-One-CK7P-15V) tamhan@TAMHAN18:~/BattLabonespace/BattLab-One$ python BattLab-Release_V1.2.1.py
. . .
_tkinter.TclError: error reading bitmap file "icons\bbirdlogo.xbm"
The solution is to open the TK-Inter-GUI by removing the line:
root.iconbitmap(bitmap=GetIconPath())
to remove the program icon. On this occasion you can adjust the file path using:
img = PhotoImage(file='/home/tamhan/BattLabonespace/BattLab-One/icons/bbirdlogo_png1.png')
The next attempt to execute it shows that the TK-Inter environment is looking for the bblogo.gif file in the wrong folder
_tkinter.TclError: couldn't open "/home/tamhan/.local/share/virtualenvs/BattLab-One-CK7P-15V/lib/python3.8/site-packages/matplotlib/mpl-data/images/bblogo.gif": no such file or directory
You can therefore copy any GIF file into this directory and give it the appropriate name. If you now comment out the following line, you can start the program with a slightly limited range of functions (Figure 4):
#toolbar.children['!button8'].config(command=select_range)
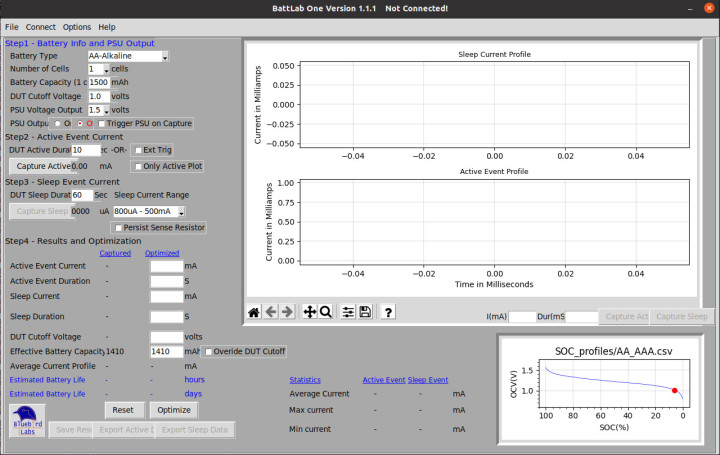
Deactivation of the measuring range button turns out to be uncritical in practice, because the MatPlotLib diagram is problematic in terms of usability anyway. Many labels appear cut off and the size of the window cannot be adjusted.
As we will see, the program has fewer problems running in Windows 10. Before changing the operating system, we can tidy up to remove the created virtual environment and thereby free up mass storage space:
(BattLab-One-CK7P-15V) tamhan@TAMHAN18:~/BattLabonespace/BattLab-One$ exit
exit
tamhan@TAMHAN18:~/BattLabonespace/BattLab-One$ cd /home/tamhan/.local/share/virtualenvs/BattLab-One-CK7P-15V
tamhan@TAMHAN18:~/.local/share/virtualenvs/BattLab-One-CK7P-15V$ rm * -rf
tamhan@TAMHAN18:~/.local/share/virtualenvs/BattLab-One-CK7P-15V$ ls
BattLab-One Running in Windows 10
The situation here is simpler in that ready-made .exe files are provided. The ZIP archive includes, among other things, the SOC_profiles subfolder, which contains the various battery profiles in tabular form. You will need to unzip the archive.
When BattLab-Release_V1.2.3.exe file is executed, the user interface display looks similar to the Linux version in Figure 4. The Windows version behaves largely in the same way but has fewer rendering errors. First we can select the battery type up in the top left area. The associated battery data is used to create the characteristic discharge curve shown at the bottom right. To the right of the PSU Output field, On and Off buttons switch the integrated voltage converter to power the DUT connected at the two output sockets.
I have been working on my own IoT sensor project called HygroSage for some time now. With its colour display and powerful processor, it would be an ideal candidate to test out BattLab-One. I connected the sensor. By clicking on the option Capture Active, the software shows a flikering green progress bar labeled Active Event Current and then does nothing visible for 10 seconds. During this time, the system measures the information and finally displays it as shown in Figure 5.
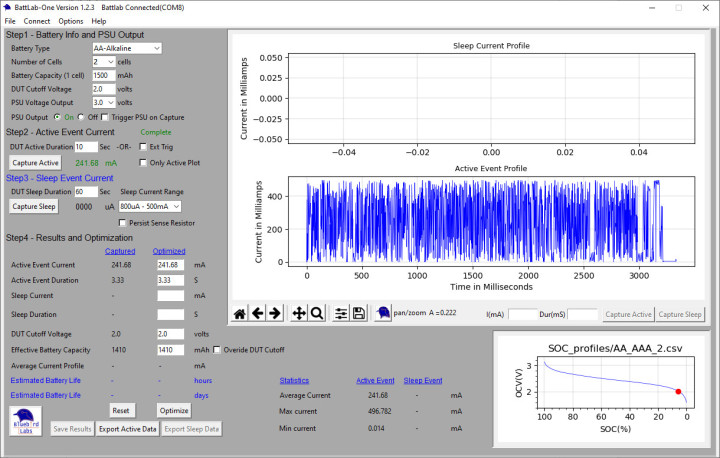
The value of any point of the waveform can be displayed using the cursor. In practice, however, this does not work quite as convincingly because the value indicated in the text box below does not show the measured value, but the position of the mouse pointer on the graph. This means you need to move the mouse pointer to a point on the curve. In addition, there is no really convenient way to zoom into the diagram (generated by MatPlotLib). Despite the full HD resolution of my screen, I wasn’t able to expand the user interface screen but it is possible to select an area of the waveform using the Zoom to Rectangle option.
For testing purposes, I connected a calibrated, high-quality multimeter in series with the DUT, which measured a current of around 32 mA. BattLab-One did not agree with this; it would seem the type MCP1640 switching regulator in BattLab-One generates noise that actually interferes with BattLab-One. As a second test, I used a 1-kΩ resistor as a load for BattLab One and specified output voltage of 3 V. The result is the trace showing measurement quantisation noise in Figure 6. Connecting a 100-µF electrolytic capacitor in parallel did not result in any significant improvement of the quantised current consumption waveform.
Sleep Mode Capture and Optimization
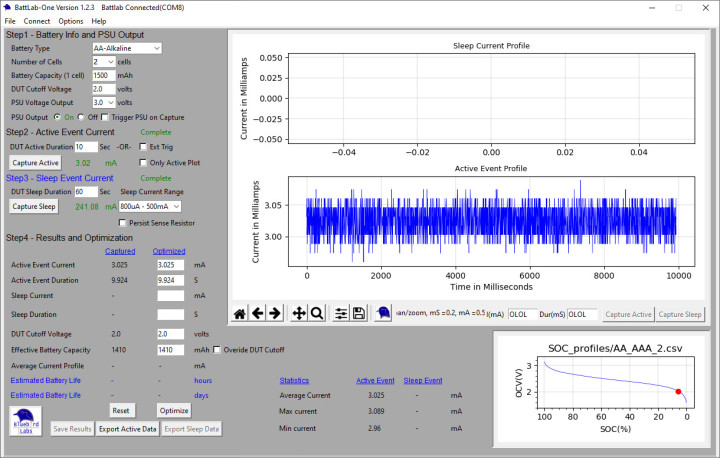
Once the active current consumption has been captured in Step 2, we can move on to Step 3 to measure sleep current. Here we need to ensure the DUT will be in sleep mode when the measurement is taken. We now enter parameters as we did in Step 2 for the active mode capture. Unless things went badly wrong with your design the device will always consume significantly less power in sleep mode. BattLab-One gives you the option to switch the current range in sleep mode between 10 uA – 800 µA or 800 µA – 500 mA to improve measurement resolution. Be aware that the device shouldn’t draw too much current in the lower measuring range. According to the documentation, a load current exceeding 250 mA can damage the hardware. With the DUT running in sleep mode we can now press Capture to record the current.
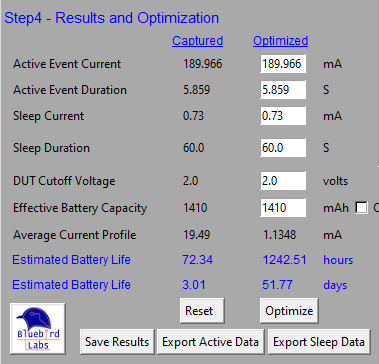
The results after a test with Hygrosage are shown in Figure 7. In Step 4, the system displays the calculated values. Using this data we can play around with the battery characteristics and capacity together with the active/sleep times and then click on Optimize to easily see what sort of battery life we can expect for the device when it is deployed in the field.
The battery life prediction will be reasonably accurate for devices which operate with a defined active and sleep period. Some devices rely on an external event interrupt to wake from a sleep mode; in this case, we can only work out the battery life by using an estimate of how often we can expect the interrupts to occur.
Open-Source and Usable
The BattLab-One hardware is quite usable. This software however has scope for improvement. The design is open-source so we can expect its evolution to benefit from community support. This also gives you the opportunity to explore BattLab’s inner workings and even to adapt and improve the software as required so that BattLab-One fits your own requirements. When it comes to hardware, BattLab-One does a lot of things right and very little wrong. Its low price and high performance makes it a good addition to the test bench for those developing IoT devices.
Discussion (0 comments)