The Past and Future of Renewable Energy Deployment in Light of the COP21 Agreement
How are Western nations going to meet the challenges set in COP21? Renewable energy and biofuel deployment in the USA and Germany are analysed in order to gain insights into their climate-related strategies.
“We must look back into history to understand our energy problem. Twice in the last several hundred years, there has been a transition in the way people use energy.
The first was about 200 years ago, when we changed away from wood--whi...
How are Western nations going to meet the challenges set in COP21? Renewable energy and biofuel deployment in the USA and Germany are analysed in order to gain insights into their climate-related strategies.
“We must look back into history to understand our energy problem. Twice in the last several hundred years, there has been a transition in the way people use energy.
The first was about 200 years ago, when we changed away from wood--which had provided about 90 percent of all fuel—to coal, which was much more efficient. This change became the basis of the Industrial Revolution.
The second change took place in this century, with the growing use of oil and natural gas. They were more convenient and cheaper than coal, and the supply seemed to be almost without limit. They made possible the age of automobile and airplane travel. Nearly everyone who is alive today grew up during this period, and we have never known anything different.”
Looking back on 2015, the G7's declaration at the Elmau Summit on June 8th, which committed to a decarbonized world economy by the end of this century, was an indicator of a changing political atmosphere. As the title page of the Elmau summit's “Leader's Declaration” stated: "Think ahead, act together." It hinted at the determination to be manifested by Western leaders going into the 21st Conference of the Parties summit in December (CP.21 or “COP21”, Framework Convention on Climate Change). Here, we examine trends in Germany and the USA, as representative Western economies on the two sides of the Atlantic, in an effort to trace past and future developments in the renewable energies arena in the EU and the USA.
It remains to be seen whether the desired concerted action declared at the closing of COP21 actually takes place in the years to come. The complex language and structure of the COP21 agreement is interesting in its own right, and will not be analyzed in detail here. However it is worth noting some strategic issues pertaining to the resulting document to be signed by April 2016. In the first place, Article 2 commits to limiting the global increase in average temperature to below 2ºC. To achieve this, Article 3 commits to a program of greenhouse gas (GHG) emission peaks, hence compelling a tacit causal admission by signatories that this is the mechanism by which temperature rise has to be impeded. In addition to reduction in primary GHG emissions, Article 5 promotes establishment of sinks and reservoirs to further reduce atmospheric GHG emissions. Subsequently, articles (6-29) outline a series of institutional and financial mechanisms to support signatory nations in achieving the net reduced emission goals.
As indicated by Article 9 in the agreement, for the future signatories it is clear that developing countries will require considerable financing for a transition to an economy based on renewable energies and sustainable development. Though not specifically set in Article 9, it is indicated in the introductory section (item 54) that the developed countries have the hefty goal of mobilizing at least USD 100 billion a year until 2020 for “meaningful mitigation actions,” which would presumably include financing and subsidies.This was something which was already mentioned in the Copenhagen Accord of December 2009 (COP20) and reiterated in Elmau. The original purpose was to facilitate the transition of developing economies towards renewable energy technologies. However the USD 100 billion quantity was not legally binding in COP20, nor is it as of yet since COP21. To echo this concern, Chancellor Merkel emphasized at Elmau that the operative term in future agreements should be the word "binding." Nonetheless, what we do have at present is a set of officially tendered national “promises,” referred to as Intended Nationally Defined Contributions (INDCs). To put the aid numbers being discussed in context, note that in 2013 Germany spent € 16.1 Billion on renewable energy installations within its territory. The government further spent € 800 million in energy R&D, of which € 600 million was for renewable energies. Also, between 2007 and 2013, they received more than € 160 million for renewable energy R&D from the EU´s 7th Framework Program (source: Bundesministeriums für Wirtschaft und Energie (BMWi) 2014). The 2015 budget assigned to energy-related issues distributed between six German ministries was around € 4.3 billion. In other words, if actually mobilized, the collective USD 100 billion is not “peanuts” for the financing parties.
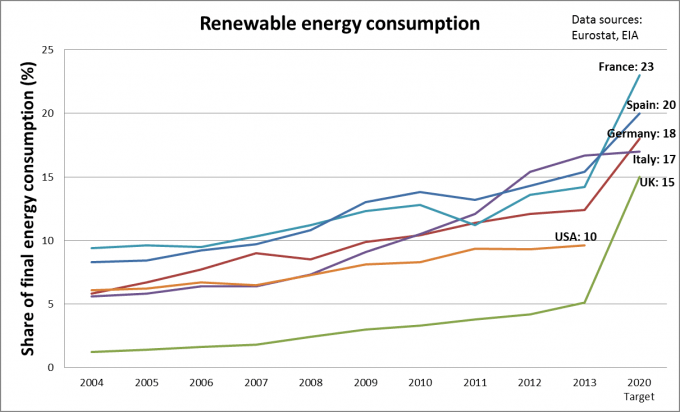
Within the technological realm, principal signposts to monitor future efforts and progress will be financing, technological innovation, deployment, and of course, GHG emissions and temperature variation. Clearly, to achieve the goals declared in COP21, part of the corresponding monies in each country would have to translate to technological innovation and deployment. The relation between funds, innovation and deployment is complex, however tracking the deployment and partitioning of technology in renewable energies can give us an indication of present and near-term trends. For example, within its Horizon 2020 program, the EU has the goal of achieving an average 20% renewable energy share for its final energy consumption (Figure 1). Within this context all European G7 partners are reasonably on track vis a vis their national goals, except for the UK which is a laggard based on the data. In comparison, even the U.S. which is an industrial and emissions behemoth, is approaching the 10% mark for its renewable energy share. Also essential to note are developments in the key player, China (not shown). According to a 2014 assessment by the International Renewable Energy Agency (IRENA), in 2010 about 7% of China´s energy mix was produced by modern renewables (excluding 6% for traditional biomass). The “business as usual” projections for China by 2030 are 16%, while the optimistic scenario goes up to a 26% share of renewables in electricity generation (p.54, IRENA). To reach this 26% share, the estimated costs are USD 145 billion per year (p. 3, IRENA).
Figure 1. Trends in renewable energy consumption in select EU economies and the USA. Last column shows 2020 targets (except for USA)
The technology mix: terra, aqua, aer et ignis
It is instructive to examine the energy mix and technologies used by the larger economies to achieve the numbers in Figure 1. Within the context of its Energiewende (“Energy Transition”), Germany had set the goal of achieving an 80% renewable share in its electricity consumption by 2050 (presently about 25%). U.S. administrations in the last decades have placed emphasis on energy security and independence. Part of this vision includes renewable energies. However determination of the targeted share of renewables is less centralized and depends on state legislation. Since March 2015, 29 states plus Washington D.C. have implemented renewable energy targets in their electricity production (referred to as “Renewable Portfolio Standards” or RPS). These can range from 33% by 2020 in California to 2% by 2021 in South Carolina. Typical values are in the 10-20% range. There has also been considerable support for biofuel production and the associated R&D across the USA in the last decade. Furthermore, hand in hand with the higher demand for renewable energy, is a trend towards distributed power in the US electricity grid. Among the advantages of smaller distributed generation facilities is that they can be turned on and off more effectively based on variable supply and demand. Furthermore, they can lead to a more resilient power grid. A 2014 report by GE (p. 27) estimates that the global share of distributed power additions per year have grown from 21% in 2000 to 39% in 2012. The projection for 2020 is 42%, amounting to 200 GW per year. Based on this observation, it is likely that countries that see a strong growth in distributed power are likely to see some form of disruption in their electricity production market. Such a disruption may be in the making in the USA. A study by the Pew Charitable Foundation indicates that as the installation costs of wind and solar facilities have decreased, the number of installations have increased in the USA. In 2014, 48% of new installed capacity in the US was wind and solar. Furthermore, the other major player in new capacity was natural gas, which is replacing the use of coal, and is a potentially cleaner and more versatile alternative. The increased use of natural gas is partly propelled by the improved methods of recovery that have led to a cheaper and more reliable supply in the USA.
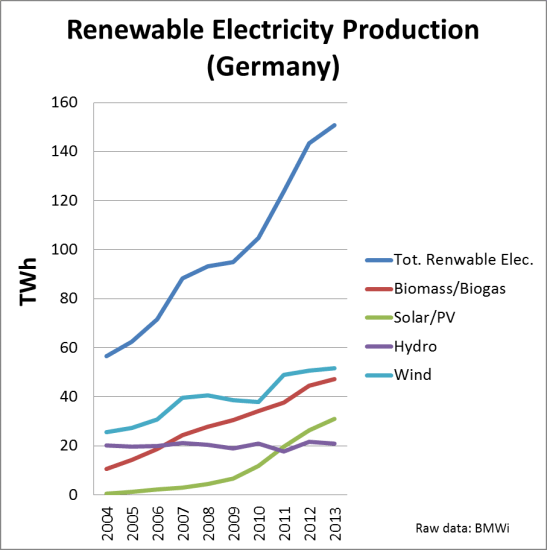
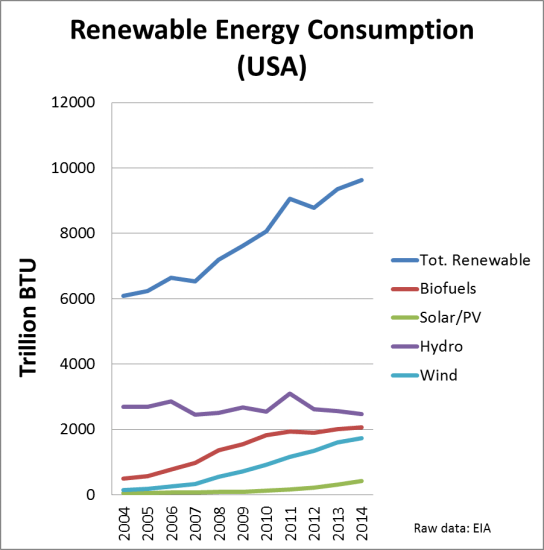
In the German case, two of the major influences in the specific configuration of their Energiewende have been a move away from nuclear energy since 2011 (partly motivated by the Fukushima disaster), and the lack of a significant home-grown supply of fossil fuels other than coal. Although Germany is a major consumer of natural gas provided by Russia, their gas supply is generally more expensive than the US and dependent on imports. Although there may be new technologies available in the future to complement electricity generation (such as hydrogen storage), for now they have to make do with a renewables and imported fossil fuels mix, in addition to their nuclear and coal facilities. Wind energy is the major producer of renewable electricity in Germany, followed by biomass and solar (Figure 2). However, the greatest increases in the 2004-2013 period were achieved by biomass and solar (+37 and +30 TWh, respectively. Wind energy increased by 26 TWh in comparison). The large contribution by biomass can be surprising since wind and solar generally get more press (by both the national press and government reports). Nonetheless, much of the biomass/biogas technologies deployed are relatively mature, and much of the technological innovations are occurring in the solar and wind department. The year 2011 led to 242 published international Patent Cooperation Treaty (PCT) applications in solar (which reserves the right to subsequently apply for a patent in about 148 countries), while there were 138 PCT applications in wind and 43 in biomass-dependent energy production (BMWi). Also notable are 372 PCT applications in energy storage. These numbers emphasize the focus on electrical energy production and storage (note that PCT applications are generally published 18 months after their priority date, hence the reporting lag). The German PCT numbers for 2010 and 2009 show similar numbers. These proportions are also representative of global trends. According to the World Intellectual Property Organization (WIPO), the average growth rate in global PCT patent filings in the 2006-2011 period for wind is at 27%, solar in the 22-24% range, and biofuels at 13%. Broad-based major players in the renewables patent filing arena are China, Germany, Japan, Republic of Korea and the USA (alphabetically ordered). Figure 3 shows the energy mix in the US renewables landscape. Solar has not taken off yet in the same way as it has done in Germany, however wind energy and biofuels have exhibited a strong period of growth in the US during the last decade. In its 2015 “World Energy Outlook”, the International Energy Agency (IEA) projected that the global demand for primary energy will grow by about 32% from 2013 to 2040 under its “new policies scenario” (the projected range is between 12% for the 450ppm CO2 scenario and 45% for the current policies scenario). Although coal, oil and gas are to remain dominant, the share of nuclear and renewables is to reach about a quarter of the total. Whether we surpass or underperform on these projections will largely depend on the success of the policies and actions delineated in the COP21 agreement. IEA projections indicate a decreased share of fossil fuels in energy demand growth in the USA, EU and Japan. However, the projections for China, India and other non OECD countries are for higher amounts of fossil fuels. If IEA projections into 2040 hold, the increased fossil fuel use by non-OECD countries is projected to be at least three times larger than the reduction in the OECD countries.
Figure 2. Renewable energy mix in German electricity production.
Figure 3. Energy mix in US renewable energy consumption.
Biofuels and the transportation fuel challenge
A nation's energy procurement strategy -whether renewable or not - is inevitably dependent on the natural resources available to it. Canada can generate 60% of its electricity through hydropower (Canadian Hydropower Association). Iceland generates 25% of its electricity through geothermal (National Energy Authority, Iceland). Sugarcane grows well in Brazil. Hence, based on the fermentation of sugarcane, Brazil has had a bioethanol blend of 20-27% in motorcar gasoline throughout this century. Consequently, up to recent times Brazil had been the model economy for the use of biofuels in the transportation sector. During the “boom years” of biofuels at the beginning of this century, the USA and the EU followed suit and scurried to incorporate biofuels in their transportation portfolio. This biofuels transition has been more complicated than that pertaining to renewables in the power generation sector.
First and second generation biofuels require feedstock, which comes from agriculture. They also need bio-refineries. Hence a large scale biofuels program requires the corresponding agricultural production network and transport logistics to bring the feedstock to a bio-refinery. Brazil has ample arable land, agricultural muscle and low-density population areas to do this, so does the USA. However Europe is different in this respect. The 2012 population density of the EU28 was 116.3 individuals per Km2 (Eurostat). For Germany, the number is at 226 per Km2 (Statistiches Bundesamt, 2013). Meanwhile Brazil and the USA are at 24 and 35 individuals per Km2, respectively (World Bank, 2013). Due to the available farmland, the logistical and agrarian implications of a biofuel-based transportation sector are consequently very different. This means that the EU cannot necessarily copy the Brazilian or American models.
In a pair of 2009 directives, the EU set the 2020 goal of a 10% renewables share in its transportation energy use, and a 6% reduction of life-cycle greenhouse gas (GHG) emissions from energy supplied to the transport sector. Given that the European motor vehicle fleet is dominated by diesel engines, this translated to an increased demand for vegetable oils - the raw material for biodiesel production. This has led to a significant increase in vegetable oil imports into the EU, and has raised sustainability concerns. As a consequence, in April 2015 the EU passed the “Indirect Land Use Change (ILUC)” directive in order to assure life-cycle emission reductions. The ILUC directive limits the share of food-crop derived biofuels to 7% of transportation energy. The remaining renewable energy share in transport would have to come from electricity, hydro-treated vegetable oil (HVO), animal fat and “advanced” biofuels based on residual feedstock (e.g. lignocellulose). These alternative fuels benefit from extra accounting benefits towards the 10% target. Hydrogen generation would be also an attractive alternative, but is presently mired by cost viability issues.
It is still too early to see how the ILUC directive will change the biofuel arena within the EU. So far most European countries are just above the half-way point towards the 10% mark. It remains to be seen which technologies will further take on the mantle of renewables in transport. What is apparent is that after 2020, the EU does not have the agricultural portfolio to go beyond the 10% mark by using vegetable oils. The 2012 harvest of oil-bearing plants in the EU was 34 million tons, while the cereal harvest was 240 million tons. The principal regions where these two crop types are cultivated in Europe are the same (northern France and northeast Germany are among the top producers).
In Germany, given their present agricultural and technological landscape, the available chance for expansion of renewables into the transport sector would be the use of electricity, hydrogen or biogas. However there are no obvious nor easy routes, given that the German auto industry has built its competitive advantage on perfecting diesel and gasoline engines. The only game changer that could potentially maintain the dominance of liquid-fuel combustion engines in a hypothetical decarbonized future would be the ability to tap into the large amount of lignocellulose-based feedstock -which is mainly available from the cereal and forestry sector in the EU. However, the economic viability of lignocellulose-based bio-refineries has not been widely established yet. Nor do we understand the logistical implications of having a large number of such bio-refineries on European soil.
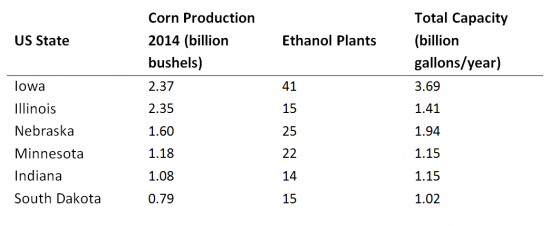
In the USA, the biofuels landscape is somewhat different from the European one. The US automobile fleet is dominated by gasoline engines, which are compatible with bio-ethanol blends. By supporting bio-ethanol and advanced biofuels, the US government can support agribusiness, biotechnology, and energy independence. Iowa, Illinois, Nebraska and Minnesota together produce over 50% of the total US maize production (US total was 13.6 billion bushels in 2015, USDA). Not surprisingly, the major concentration of ethanol bio-refineries in the USA are also in this area. Iowa by itself has 41 ethanol plants with a total capacity of 3.7 billion gallons/year. Hence, the Midwest is not only the “food basket” of America, it is becoming the ethanol wellspring of America as well (see Table 1). Together, the six states in Table 1 can produce about 10 billion gallons of ethanol per year (238 million barrels), or the energetic equivalent of 763 billion BTU (using a conversion factor of 76,330 BTU/gallon of ethanol). Given that E100 has about 2/3 of the energy content of an E10 gasoline (100% vs 10% ethanol content), these states can produce a quantity of E100 that is energetically equivalent to about 159 million barrels of E10 gasoline. This is close to the 165 million barrel consumption of gasoline in Germany for 2011 (EIA). This is significant, even if gasoline sales in Germany are volumetrically just under half that of diesel sales.
Table 1. Corn producing states and their ethanol production capacity (source: NREL Biofuel Atlas)
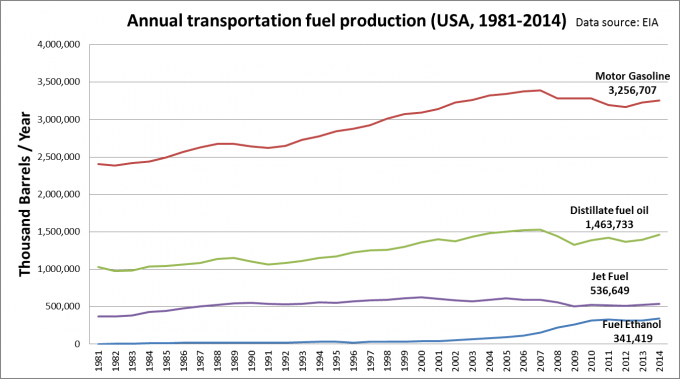
When we examine US bioethanol production as shown in Figure 4, we see that it has increased considerably in the last decade, to the point of reaching over 10% of the volume of gasoline production in the USA (in 2014, the numbers were 341 million barrels of ethanol vs. 3.2 billion barrels of gasoline, source EIA).
Figure 4. Since 2010, Fuel Ethanol production has reached approximately 10% of the volume of motor gasoline supplied in the USA.
The combination of supportive policies, R&D strength, available land, and agricultural capacity has allowed the US to be in an enviable strategic position to further develop its biofuels industry. The last decade has allowed the US to accumulate the know-how and industrial capacity to produce transport-grade bioethanol at significant volumes. As second generation biofuel production technologies mature, the US is well positioned to make the transition to higher production capacities based on lignocellulose-based material such as corn stover. Furthermore, the US is well positioned to increase its agricultural productivity via new developments in biotechnology. The challenge will be to increase this productivity while minimizing the environmental footprint. The EU scenario has not been as impressive for the production of biofuels. However, this is offset to a large degree by the clear intent to push forward the generation of renewable electricity based on wind and solar energy. Under the present technology landscape, unless Germany increases its biofuel (or biogas) production capabilities, a hypothetical decarbonization would mean that they would have to rely on an electrical (whether hybrid or not) or hydrogen scenario. Otherwise, the only way that combustion engines could remain in circulation is to reduce engine consumption. However, without biofuels or biogas, the consumption game in combustion engines cannot be played to the point of zero net-emissions. Given that some of the world´s leading manufacturers of liquid-fueled automobiles are German, the implications of the tradeoff between biofuels and renewable electricity will become an increasingly pressing issue for German government and industry. This will be also an issue in the French, Italian and Spanish cases, given that they also have a significant auto-manufacturing sector as part of their economy.
A potential avenue to reduce emissions in transport may be a transition from liquid fuels to gas as a “bridge fuel”, especially in regions such as North America, Russia, Central Asia and the Middle East, which have access to a cheap and autonomous supply. However a mass transition towards gas powered vehicles is not in the making as of yet. For countries that do not have access to an autonomous supply, an alternative would be biologically produced gas. However, this would require the future resolution of cost, logistic and scaling hurdles.
2030 on the Horizon
Decision makers and stakeholders need to have their eyes open towards the decisions that the EU will take towards the close of 2020, when they benefit from reviewing their past success, and consolidate their strategy for the following 10 year period (2030). As of 2014, the EU had decided on 2030 goals that entails a renewables share of 27% of final energy consumption, and GHG emission reductions of 40% (in comparison to 1990 levels). Recall that for 2020, both respective targets were 20%. The 2030 numbers are the ones that the EU also delivered as its INDC to COP21. The policy direction taken in the US is less centralized and perhaps more unpredictable, especially since the extent of commitment to GHG emissions reduction can be dependent on the political party in power. Nonetheless, there is a clear push towards lower emissions by the present executive branch. The USA´s INDC target is a 26-28% reduction in GHG emissions by 2025 (in comparison to 2005 levels).
Needless to say, in addition to concerns regarding GHG emissions and global warming, a universally dominant factor that will affect future policy and technology trends on both sides of the Atlantic and in Asia, will be the global availability and price of fossil fuels. When crude prices are high and supplies low, R&D investment in alternative fuel technologies often increase (the DOE’s Aquatic Species Program and similar biofuel programs from the late 70’s are a Déjà vu reference for more recent developments in the last decade). However, when crude prices topple, a commitment to fossil fuel alternatives can falter, especially in R&D financed by industry or government. In this respect, China is a key actor. Both in terms of its willingness to collaborate on the goals set in COP21, and the effects of its economic activity on the price of fossil fuels. Nothing has made this more apparent than the recent oil glut and acute fall in the price of fossil fuels. In a low oil price environment, interest in renewable energies and sustainability can wane if solely driven by cyclical economic concerns. Political will, motivated by a concern for environmental consequences would have to be a major driving factor for the implementation of COP21.
Homayoun Bagheri is a Senior Technologist at the Repsol Technology Center and is also involved with start-up advising activities at the Entrepreneurs Fund of the Repsol Foundation. He has been active in life-science and technology research on both sides of the Atlantic for 25 years.
Bernardo del Amo is a Senior Technology Advisor at the Repsol Technology Center, and has a 36 year track record of R&D activity at Repsol. He is the manager of the open innovation platform “Inspire,” focusing on technological challenges in the energy industry.
The opinions expressed here are those of the authors and do not represent any institution.
This study was originally released for the non-profit Entrepreneurs Fund of the Repsol Foundation. A PDF version is available at Ssrn.com.
Image credits. Graphs and tables were produced by the authors. Top image: Middelgrunden wind farm. By: Kim Hansen CC-BY licence.
Elektor Magazine has been one of the leading sources of information on electronics for engineers, designers, start-ups and companies for 65 years. Our magazine is powered by an active community of electronics engineers – from students to professionals – who are passionate about designing and sharing innovative ideas.
For them, we publish hundreds of items a year, in formats such as articles, videos, webinars, and other learning formats. Our mission is to share knowledge in every possible way and inspire readers with the latest developments within the electrical engineering sector.
Thank you for your vote!
Leave further comments in the fields below.
Thank you for your vote!
If you wish to leave a comment with your rating, please first use the login below. If not, just close this window.


Discussion (0 comments)