
Wind Reports for Wind Farms
January 13, 2016
on
on
Valid wind measurements, prediction of energy yield and wind reports are essential to ensure wind farm profitability. However, in the past the calculated results sometimes differed considerably from the actual energy yield, as some crucial aspects of the methods applied in the preparation of these forecasts had not been clearly regulated. The Federation of German Wind Power and Other Renewable Energies (FGW) corrected and eliminated this problem by issuing a revised version of the Technical Guideline, Part 6 [1] last September.
Two independent bankable yield reports are the minimum required to convince banks and investors of the bankability of a wind-farm project and to secure its funding. Within the scope of this process, the stakeholders also scrutinise the yield forecasts, which can be calculated in a variety of ways. Given this, the wind professionals that prepare these two reports face the same challenges: what input data are available and can be used to calculate the energy yield at the site? What measurements have been conducted on site, and which existing wind turbines can be used for validation of the model? Which methods of analysis should be applied for the evaluation? Over which period of time was the on-site measurement performed? Is this period of time representative for drawing conclusions regarding the annual yield and preparing forecasts for 20 years of operation? In other words, the question is whether a minimum of suitable information is available for the site itself and its surroundings to forecast realistic energy yields.
The new Technical Guideline TR 6 Revision 9 has normative character for wind reports. It now defines detailed requirements and establishes new, fairly rigorous criteria. The designation of "Wind Report", for example, may only be applied to documents that use yield data from other wind-energy turbines (“validation turbines”) or wind measurements that are no further than ten kilometres from the planned site in each case. In areas characterised by complex topography (gradients of over ten per cent, differences in altitude of over 50 metres between the data used as a basis and the planned wind farms), the permitted distance may not exceed two kilometres. The Technical Guideline also provides more specific information on the ratio between the actual hub heights used in measurement and the hub heights of the planned turbines. Under the revised Technical Guideline, it is recognized that the vertical extrapolation of measured data and yield data should be within 2/3 of the planned hub height.
By publishing the 9th revision of the TR 6, the FGW eliminated the existing leeway which had resulted in the use of validation turbines at distances of 20 km (or even significantly more in exceptional cases) or with hub heights that were far too low for calculation – even though the sites were by no means comparable in terms of topography and wind conditions. In the past, this approach increasingly produced unrealistic and clearly excessive yield forecasts. The wind farms then realised at high cost failed to produce the energy yields and the income required for profitable operation.
The revised TR 6 reduces this risk and improves transparency. However, stakeholders are now facing a new challenge: due to the stricter requirements, there are frequently no suitable data for analysis in the region. Where this is the case, the stakeholders need reliable wind measurements, which – depending on the situation on site – may generate six-figure costs, e.g. in the case of 12-month on-site measurement at hub height. Unless similar wind turbines exist at, or in the direct vicinity of, the site, this method still delivers the best data, but is also the most expensive. Efficient and cost-effective alternatives that do not compromise on data quality and informative value are therefore in high demand.
TÜV SÜD’s wind-energy experts have developed a new method applicable to large numbers of cases that fulfils the criteria of FGW TR6. Instead of a measurement mast, the method is based on wind measurement with the help of light detection and ranging (LIDAR) and data from the local weather service. Yield data are often available from wind energy turbines in the wider region. However, taken on their own, these data cannot fulfil the requirements of FGW TR6 (e.g. because of insufficient hub height). They must therefore be complemented with other data to permit a reliable forecast to be drawn up.
Taking repowering as an example, in this situation the wind conditions at the site are largely known because of the data collected over years of operation of existing wind energy turbines. However, the question is whether and how these conditions can be extrapolated to the higher atmospheric layers in which the rotor will later revolve around the hub. Here, a LIDAR measurement frequently offers a good solution for generating the missing data from the higher atmospheric layers.
An especially important factor in this method is the measurement period. Meteorology differentiates between stable systems of atmospheric layers (frequently in winter) neutral, and unstable systems (mostly during summer months when wind-speeds are low). They have significant impacts on wind systems and wind profiles, i.e. wind speeds at various heights above ground, and result from the differences in temperature between near-ground and higher atmospheric layers.
For wind measurements with LIDAR systems, this means the measurement period must include all possible types of atmospheric layering relevant for the site in question in the proportions that are characteristic for the course of an average year. To ensure that the results are representative for the entire course of a year, minimum periods must be mapped for each class of atmospheric layer.
As layering systems are not local phenomena restricted to the site of measurement, data from the German Weather Service (or other local weather service) can be used to make sure that this criteria is fulfilled. Such measurement periods usually span many years providing information about the past frequency and seasonal distribution of the various weather conditions. These data can then be put in relation with the LIDAR measurement period and be continuously compared. Once the comparison of the data shows that these data map a representative period, measurement can be discontinued. This can be achieved in a time frame from usually 3 to 6 months. This approach allows for reliable mapping of the wind profile at the site of measurement. In conjunction with the set of data collected from wind turbines with low hub heights, this creates a data package that can be used to prepare a yield report in conformity with the FGW requirements and at the same time allows a reduction of measurement time and cost.
These and other methods of wind data validation are still largely unknown in the wind industry. In many instances, there is still a lack of empirical values and insufficient understanding of the technical context. In light of the above, the involvement of third-party wind experts such as the wind professionals from TÜV SÜD is recommended to ensure yield forecasts that rest on a solid foundation of data.
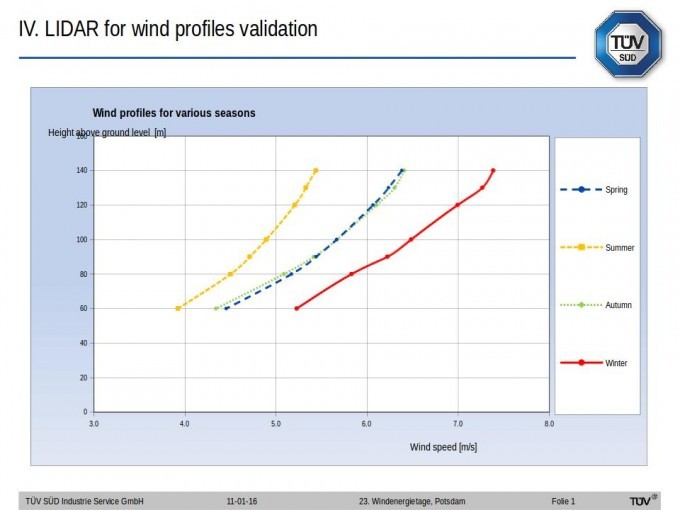
Figure 1 shows the wind profiles of a site at different seasons. The figure clearly shows several effects, including that wind blows more strongly in winter. The increase in wind speed at higher layers of the atmosphere is likewise more pronounced in winter.
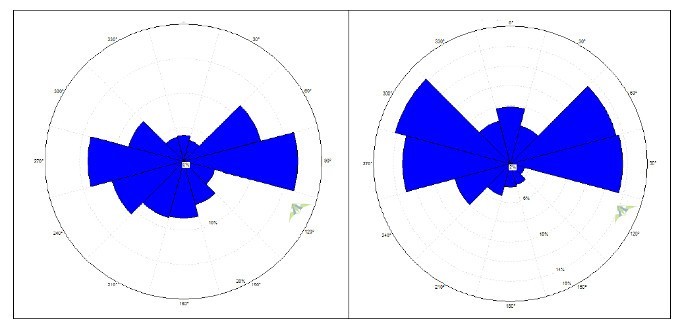
Figure 2 shows an example of the frequency distribution of wind directions for an entire year (left) and a three-month measurement (right), given in per cent per 30° sector. Where large variations in distribution occur as here, corrective actions are permitted according to FGW TR6 provided the data are filtered primarily from the sectors of the secondary directions of wind while the data from the main directions of wind remain unchanged. Following the corrections, as a minimum requirement the data set must correspond to an effective measurement period of at least three months to ensure the results are in conformity with the FGW requirements and thus valid.
1. FGW e. V. – Fördergesellschaft Windenergie und andere erneuerbare Energien (Federation of German Wind Power and Other Renewable Energies): Technical Guidelines for Wind Turbines, Part 6 – Determination of Wind Potential and Energy Yields; 9th Revision of 22 September 2014.
Thomas Arnold is Team Leader Measurements and Technical Testing for Wind Energy Turbines at TÜV SÜD Industrie Service GmbH.
Thomas Zirngibl is Team Leader Site Assessment & Technical Due Diligence at TÜV SÜD Industrie Service GmbH, Thomas.Zirngibl@tuev-sued.de.
TÜV SÜD Industrie Service GmbH, Wind Cert Services, Regensburg
Germany tuev-sued.de/windenergie.
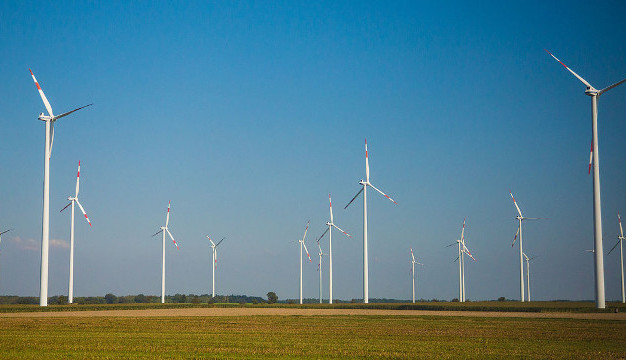
Image: Wind turbines in rural Germany. By: Tony Webster. CC-BY licence.
Two independent bankable yield reports are the minimum required to convince banks and investors of the bankability of a wind-farm project and to secure its funding. Within the scope of this process, the stakeholders also scrutinise the yield forecasts, which can be calculated in a variety of ways. Given this, the wind professionals that prepare these two reports face the same challenges: what input data are available and can be used to calculate the energy yield at the site? What measurements have been conducted on site, and which existing wind turbines can be used for validation of the model? Which methods of analysis should be applied for the evaluation? Over which period of time was the on-site measurement performed? Is this period of time representative for drawing conclusions regarding the annual yield and preparing forecasts for 20 years of operation? In other words, the question is whether a minimum of suitable information is available for the site itself and its surroundings to forecast realistic energy yields.
The new Technical Guideline TR 6 Revision 9 has normative character for wind reports. It now defines detailed requirements and establishes new, fairly rigorous criteria. The designation of "Wind Report", for example, may only be applied to documents that use yield data from other wind-energy turbines (“validation turbines”) or wind measurements that are no further than ten kilometres from the planned site in each case. In areas characterised by complex topography (gradients of over ten per cent, differences in altitude of over 50 metres between the data used as a basis and the planned wind farms), the permitted distance may not exceed two kilometres. The Technical Guideline also provides more specific information on the ratio between the actual hub heights used in measurement and the hub heights of the planned turbines. Under the revised Technical Guideline, it is recognized that the vertical extrapolation of measured data and yield data should be within 2/3 of the planned hub height.
Precise forecasts at any cost?
By publishing the 9th revision of the TR 6, the FGW eliminated the existing leeway which had resulted in the use of validation turbines at distances of 20 km (or even significantly more in exceptional cases) or with hub heights that were far too low for calculation – even though the sites were by no means comparable in terms of topography and wind conditions. In the past, this approach increasingly produced unrealistic and clearly excessive yield forecasts. The wind farms then realised at high cost failed to produce the energy yields and the income required for profitable operation.
The revised TR 6 reduces this risk and improves transparency. However, stakeholders are now facing a new challenge: due to the stricter requirements, there are frequently no suitable data for analysis in the region. Where this is the case, the stakeholders need reliable wind measurements, which – depending on the situation on site – may generate six-figure costs, e.g. in the case of 12-month on-site measurement at hub height. Unless similar wind turbines exist at, or in the direct vicinity of, the site, this method still delivers the best data, but is also the most expensive. Efficient and cost-effective alternatives that do not compromise on data quality and informative value are therefore in high demand.
Using LIDAR systems to generate valid data records
TÜV SÜD’s wind-energy experts have developed a new method applicable to large numbers of cases that fulfils the criteria of FGW TR6. Instead of a measurement mast, the method is based on wind measurement with the help of light detection and ranging (LIDAR) and data from the local weather service. Yield data are often available from wind energy turbines in the wider region. However, taken on their own, these data cannot fulfil the requirements of FGW TR6 (e.g. because of insufficient hub height). They must therefore be complemented with other data to permit a reliable forecast to be drawn up.
Taking repowering as an example, in this situation the wind conditions at the site are largely known because of the data collected over years of operation of existing wind energy turbines. However, the question is whether and how these conditions can be extrapolated to the higher atmospheric layers in which the rotor will later revolve around the hub. Here, a LIDAR measurement frequently offers a good solution for generating the missing data from the higher atmospheric layers.
Stable, neutral and unstable atmospheric layers
An especially important factor in this method is the measurement period. Meteorology differentiates between stable systems of atmospheric layers (frequently in winter) neutral, and unstable systems (mostly during summer months when wind-speeds are low). They have significant impacts on wind systems and wind profiles, i.e. wind speeds at various heights above ground, and result from the differences in temperature between near-ground and higher atmospheric layers.
For wind measurements with LIDAR systems, this means the measurement period must include all possible types of atmospheric layering relevant for the site in question in the proportions that are characteristic for the course of an average year. To ensure that the results are representative for the entire course of a year, minimum periods must be mapped for each class of atmospheric layer.
As layering systems are not local phenomena restricted to the site of measurement, data from the German Weather Service (or other local weather service) can be used to make sure that this criteria is fulfilled. Such measurement periods usually span many years providing information about the past frequency and seasonal distribution of the various weather conditions. These data can then be put in relation with the LIDAR measurement period and be continuously compared. Once the comparison of the data shows that these data map a representative period, measurement can be discontinued. This can be achieved in a time frame from usually 3 to 6 months. This approach allows for reliable mapping of the wind profile at the site of measurement. In conjunction with the set of data collected from wind turbines with low hub heights, this creates a data package that can be used to prepare a yield report in conformity with the FGW requirements and at the same time allows a reduction of measurement time and cost.
These and other methods of wind data validation are still largely unknown in the wind industry. In many instances, there is still a lack of empirical values and insufficient understanding of the technical context. In light of the above, the involvement of third-party wind experts such as the wind professionals from TÜV SÜD is recommended to ensure yield forecasts that rest on a solid foundation of data.

Figure 1 shows the wind profiles of a site at different seasons. The figure clearly shows several effects, including that wind blows more strongly in winter. The increase in wind speed at higher layers of the atmosphere is likewise more pronounced in winter.

Figure 2 shows an example of the frequency distribution of wind directions for an entire year (left) and a three-month measurement (right), given in per cent per 30° sector. Where large variations in distribution occur as here, corrective actions are permitted according to FGW TR6 provided the data are filtered primarily from the sectors of the secondary directions of wind while the data from the main directions of wind remain unchanged. Following the corrections, as a minimum requirement the data set must correspond to an effective measurement period of at least three months to ensure the results are in conformity with the FGW requirements and thus valid.
1. FGW e. V. – Fördergesellschaft Windenergie und andere erneuerbare Energien (Federation of German Wind Power and Other Renewable Energies): Technical Guidelines for Wind Turbines, Part 6 – Determination of Wind Potential and Energy Yields; 9th Revision of 22 September 2014.
Thomas Arnold is Team Leader Measurements and Technical Testing for Wind Energy Turbines at TÜV SÜD Industrie Service GmbH.
Thomas Zirngibl is Team Leader Site Assessment & Technical Due Diligence at TÜV SÜD Industrie Service GmbH, Thomas.Zirngibl@tuev-sued.de.
TÜV SÜD Industrie Service GmbH, Wind Cert Services, Regensburg
Germany tuev-sued.de/windenergie.
Image: Wind turbines in rural Germany. By: Tony Webster. CC-BY licence.
Read full article
Hide full article
Discussion (0 comments)