
Review: Black Magic Probe V2.1 – JTAG & SWD ARM debugger
Specify the right serial port
Take care when picking the serial port to connect to the Black Magic Probe GDB server. For some reason, on Windows when the port number is 10 or higher it must be preceded with “\\.\”, e.g. “\\.\COM25” (in my case). On Linux it is recommended to plug the BMP in first so that it will get the ports ttyACM0 and ttyACM1. The first one will then be the GDB server port. On my Windows system it was the second port. If GDB doesn’t return to the prompt immediately, chances are you specified the wrong port.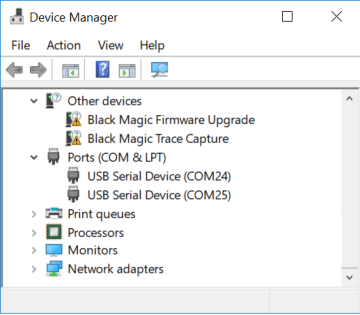
Next step is finding the target that you want to debug and attach to it. Since JTAG can have multiple devices on the bus, doing a JTAG scan will return numbers and names of available devices. In most cases there will be only one device and so you attach to device ‘1’. Now you can load an executable, and program it into the MCU with the ‘load’ command, and finally run and debug it.
Cool tool
Black Magic Probe is a good way to add debugging capabilities to your ARM toolchain. Installation of the device is as easy as plugging it in. As long as your ARM toolchain has GDB included there is no software to install at all, just point GDB to the GDB server port of the probe.Finally, the small dimensions of the BMP allow it to be connected to deeply embedded boards.
Below is the log of the beginning of a debug session.
D:\Dev\arm\1bitsy-examples\examples\1bitsy\fancyblink>arm-none-eabi-gdb
GNU gdb (GNU Tools for Arm Embedded Processors 7-2018-q2-update) 8.1.0.20180315-git
Copyright (C) 2018 Free Software Foundation, Inc.
License GPLv3+: GNU GPL version 3 or later <http://gnu.org/licenses/gpl.html>
This is free software: you are free to change and redistribute it.
There is NO WARRANTY, to the extent permitted by law.  Type "show copying"
and "show warranty" for details.
This GDB was configured as "--host=i686-w64-mingw32 --target=arm-none-eabi".
Type "show configuration" for configuration details.
For bug reporting instructions, please see:
<http://www.gnu.org/software/gdb/bugs/>.
Find the GDB manual and other documentation resources online at:
<http://www.gnu.org/software/gdb/documentation/>.
For help, type "help".
Type "apropos word" to search for commands related to "word".
(gdb) target extended-remote \\.\COM25
Remote debugging using \\.\COM25
(gdb) monitor jtag_scan
Target voltage: 3.3V
Available Targets:
No. Att Driver
 1      STM32F4xx
(gdb) attach 1
Attaching to Remote target
warning: No executable has been specified and target does not support
determining executable automatically.  Try using the "file" command.
0x0800026a in ?? ()
(gdb) file fancyblink.elf
A program is being debugged already.
Are you sure you want to change the file? (y or n) y
Reading symbols from fancyblink.elf...done.
(gdb) load
Loading section .text, size 0x690 lma 0x8000000
Loading section .data, size 0xc lma 0x8000690
Start address 0x8000568, load size 1692
Transfer rate: 3 KB/sec, 564 bytes/write.
(gdb) run
The program being debugged has been started already.
Start it from the beginning? (y or n) y
Starting program: D:\Dev\arm\1bitsy-examples\examples\1bitsy\fancyblink\fancyblink.elf
Read full article
Hide full article
Discussion (0 comments)