
Free Fresh Article: Arduino Temperature Recorder
on
Using the tiny Arduino Uno, you can build all manner of really neat small projects at modest cost. This one is a simple temperature recorder that shows on a display screen the values measured during the past 24 hours. Of particular note is the software, which manages all of the operations without recourse to external libraries.
The recorder described in this article measures the temperature over the course of a day and displays the readings on a graphic display screen. When a new measured value is added, the displayed curve is shifted one pixel to the left, so that the oldest value disappears and the newest reading appears. The interval between measurements can be changed easily to record more rapid temperature changes, for example in process control applications.
The circuit in Figure 1 showsa mere three active components (and a few passive parts) of this miniaturized temperature recorder.

Programmable temperature sensor
The DS1631 temperature sensor takes temperature readings between -55 °C and +125 °C, in the range 0 to 70 °C with an accuracy of ±0.5 °C. The resulting measurements are stored in a register with a resolution of 9 to 12 bits (according to the user’s needs) and can be read out from there. Thanks to its supply voltage range between 3.0 and 5.5 V, the sensor is suitable for interfacing to a broad variety of microcontrollers. Another remarkable feature in these times is that the DS1631 is available not only in SMD format but also as a DIP package.
The DS1631, whose address is programmable using pins A0 to A2, communicates with the controller via an I2C bus. The internal circuitry of the sensor in Figure 2 shows configuration registers that are written to by the controller and a read-only temperature register from which the controller reads the temperature detected. The sensor is controlled by the Arduino temperature recorder software, in continuous mode and with a resolution of 12 bits.

With the two registers TH and TL you can also specify a hysteresis range, enabling the DS1631 to be used as a thermostat (with switching output TOUT). However, this feature is not used in the current project.
A suitable display
These days it is common practice to employ graphic displays equipped with a serial bus (I2C or SPI). However, given that the temperature sensor used here is already provided with an I2C bus and occupies only three I/O pins of the Arduino, there are enough pins available for parallel control of the display. This does not offer us any notable advantages or disadvantages and you would save only a few pence.
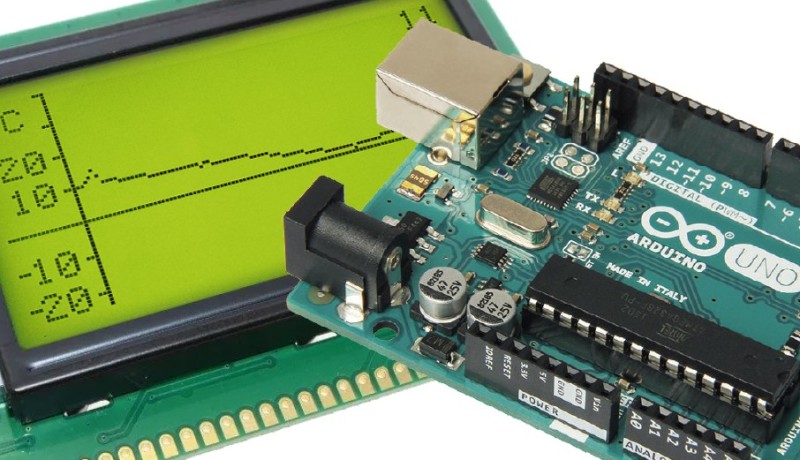
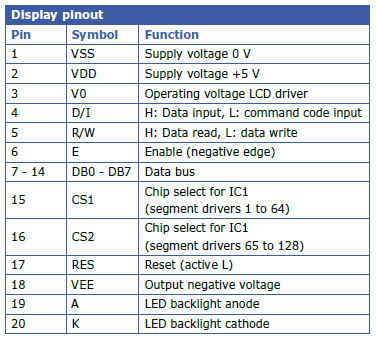
Suitable displays with 128x64 pixels are available from plenty of manufacturers (Vishay, Lumex, Winstar and so on), which sell for less than €10 / £9 / $11 on eBay and other websites. Size and screen colour choice are entirely up to you; your only major task is to make sure that the pin assignment (see table) matches, as there are several connection variants.
The graphic display (Figure 3) shows a series of 108 temperature readings in a coordinate system. If these 108 values correspond to 24 hours, the temporal resolution of the display amounts to 800 s, barely a quarter of an hour. The current temperature is shown in the upper right-hand corner of the display.

Data central
The three components of the Arduino Nano microcontroller initiate the temperature measurement process, capture the temperature values determined and transform them into pixels positioned correctly on the display.
A Sketch with no Libraries
The first thing you will notice in the fully-commented Sketch is that it does not rely on external libraries at all. All read and write operations involving the sensor and the display are performed using features already provided by the Arduino IDE.
The most important functions can be found at the end of the Sketch. The initialisation of the controller, temperature sensor and display is carried out in the setup function. In the main routine loop, the data of the temperature sensor are read out (read_temp) after being called by the clock generator (meas_flag==1) and the temperature value measured is calculated from this (cal_temp). The variable is set to zero if the displayable limit values of -23 °C and +40 °C are exceeded or not reached. From this the value of the ordinate axis (cal_measval) is calculated. The corresponding data for loading the display are determined with the new measured value (set_meas(measval)) and finally the display is updated using this. In preparation for the output of the next measurement, the pixel data of the temperature values are then shifted one pixel to the left, so that the oldest measured value disappears.
Timing in this Sketch is provided by the interrupt service routine, to be found at the very end of the Sketch. It is here that the interval between measurements is set at 800 s, so that the total of 108 displayable measurement intervals in 108×800 s = 24 h are processed just once. To test the Sketch, you can shorten the interval to, say, 2 s.
Control of the sensor is also handled towards the end of the Sketch. The 2-wire hardware interface of the controller (A4 for SDA and A5 for SCL) is used. The function write_to_config describes the configuration register. The configuration register is accessed using TWDR=0xAC and TWDR=0x0C selects the continuous 12-bit mode. After this, the function start_convert initiates the measurement mode (TWDR=0x51).
Function read_temp ensures that the two bytes of the register holding the current temperature value are read sequentially (TWCR=0x84) and stored in the variables temph and templ. The cal_temp function then converts the two binary values into the signed float-variable temp.
The 64 horizontal columns of the 128x64 dot matrix of the display are divided on a temperature scale of –23 to +40 °C, the 128 vertical rows in 19 dots for the representation of the temperature scale and in 109 dots for the temperature curve. The display itself is controlled by a segment driver for the left half (CS1) and one for the right half (CS2), divided into eight superimposed pages with 64x8 bits each.
A quick overview of operations
Array num[11][5] determines how the numeric value of the current temperature shown in the upper right-hand corner of the display is displayed, i.e. which pixels should be black. The array dmask[8][128] stores the entire display content, so as to be able to re-display the previous readings shifted one point to the left after each new measurement.
The following functions are used to control the display. Functions set_ytics and set_ylabels draw the axes labelled with the temperature scale. Function shift_left shifts the previous temperature curve one pixel to the left. Function set_meas determines which data and at which point the newly measured value is loaded into dmask. Function load_gdisp loads the display with the data stored in this array. Finally load_num enters the last measured value as a number in the upper right-hand corner, if there are no measured values in this area (otherwise it is moved further down).
The project software, with comments, can be downloaded by clicking on DOWNLOAD ATTACHMENT below.
Want more great Elektor content like this?
Take out an Elektor membership today and never miss an article, project, or tutorial.
Discussion (0 comments)