
Indoor Air Quality Meter: How Healthy Is the Air in Your Living Room?
on
In recent years, unfortunately, the quality of the air we breathe has become a not negligible problem. It has long been so for indoor environments, especially in winter, when we many of us stay enclosed in a poorly ventilated room, but also outdoors, especially in cities, whose air is increasingly contaminated by pollutant emissions from motor vehicles, heating plants (let us not forget that natural gas is not pure methane, but contains other gases and additives for odor and flame coloring…) of factories and thermal power plants and on and on; and where the scarcity of greenery does not promote the oxygenation of the air, which thus has a low oxygen content and does not promote the natural processes of the human and animal organism.
In indoor environments, air quality is impaired by elements such as the carbon dioxide we exhale, but also by particulate matter and any pathogens we may emit by breathing or coughing; think, for example, of COVID-19 infection, now long a problem we live with, which has one of its main vehicles of transmission in indoor air. The spread of this, as well as other viruses, in enclosed environments is essentially an air quality problem: the more “fouled” the air, the greater the concentration of droplets (droplets of saliva and organic fluids from mucous membranes) potentially laden with pathogens, capable of spreading disease. The solution to mitigate contagion is, of course, to operate an air exchange, to reduce the concentration of these pathogens. But when to do this, since, in both summer and winter, we tend to keep our windows closed to reduce the consumption of air conditioning and heating systems?
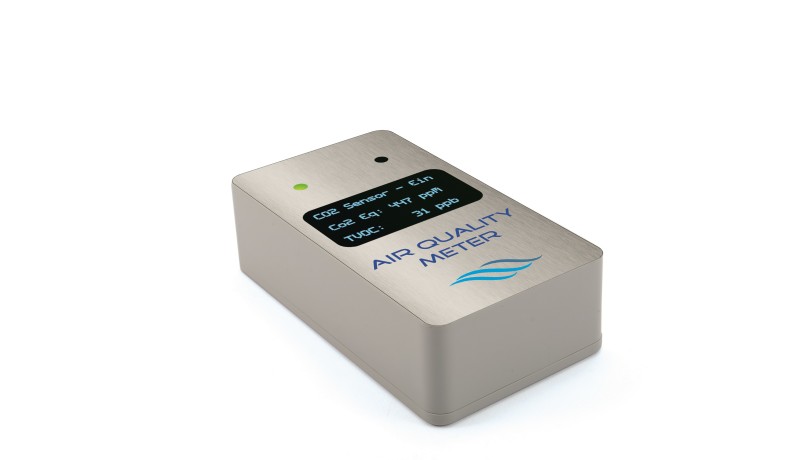
Well, in this article, we propose a simple device that, by reading a sensor of CO2 and TVOC (i.e., the concentration of suspended organic particles in the air, also known by the acronym VOC — Volatile Organic Compounds), allows us to get an idea of the air quality of a room, and through LEDs, signals us when it is time to operate a replacement, allowing us to keep air quality under control and minimize energy losses.
The Hardware of The Project
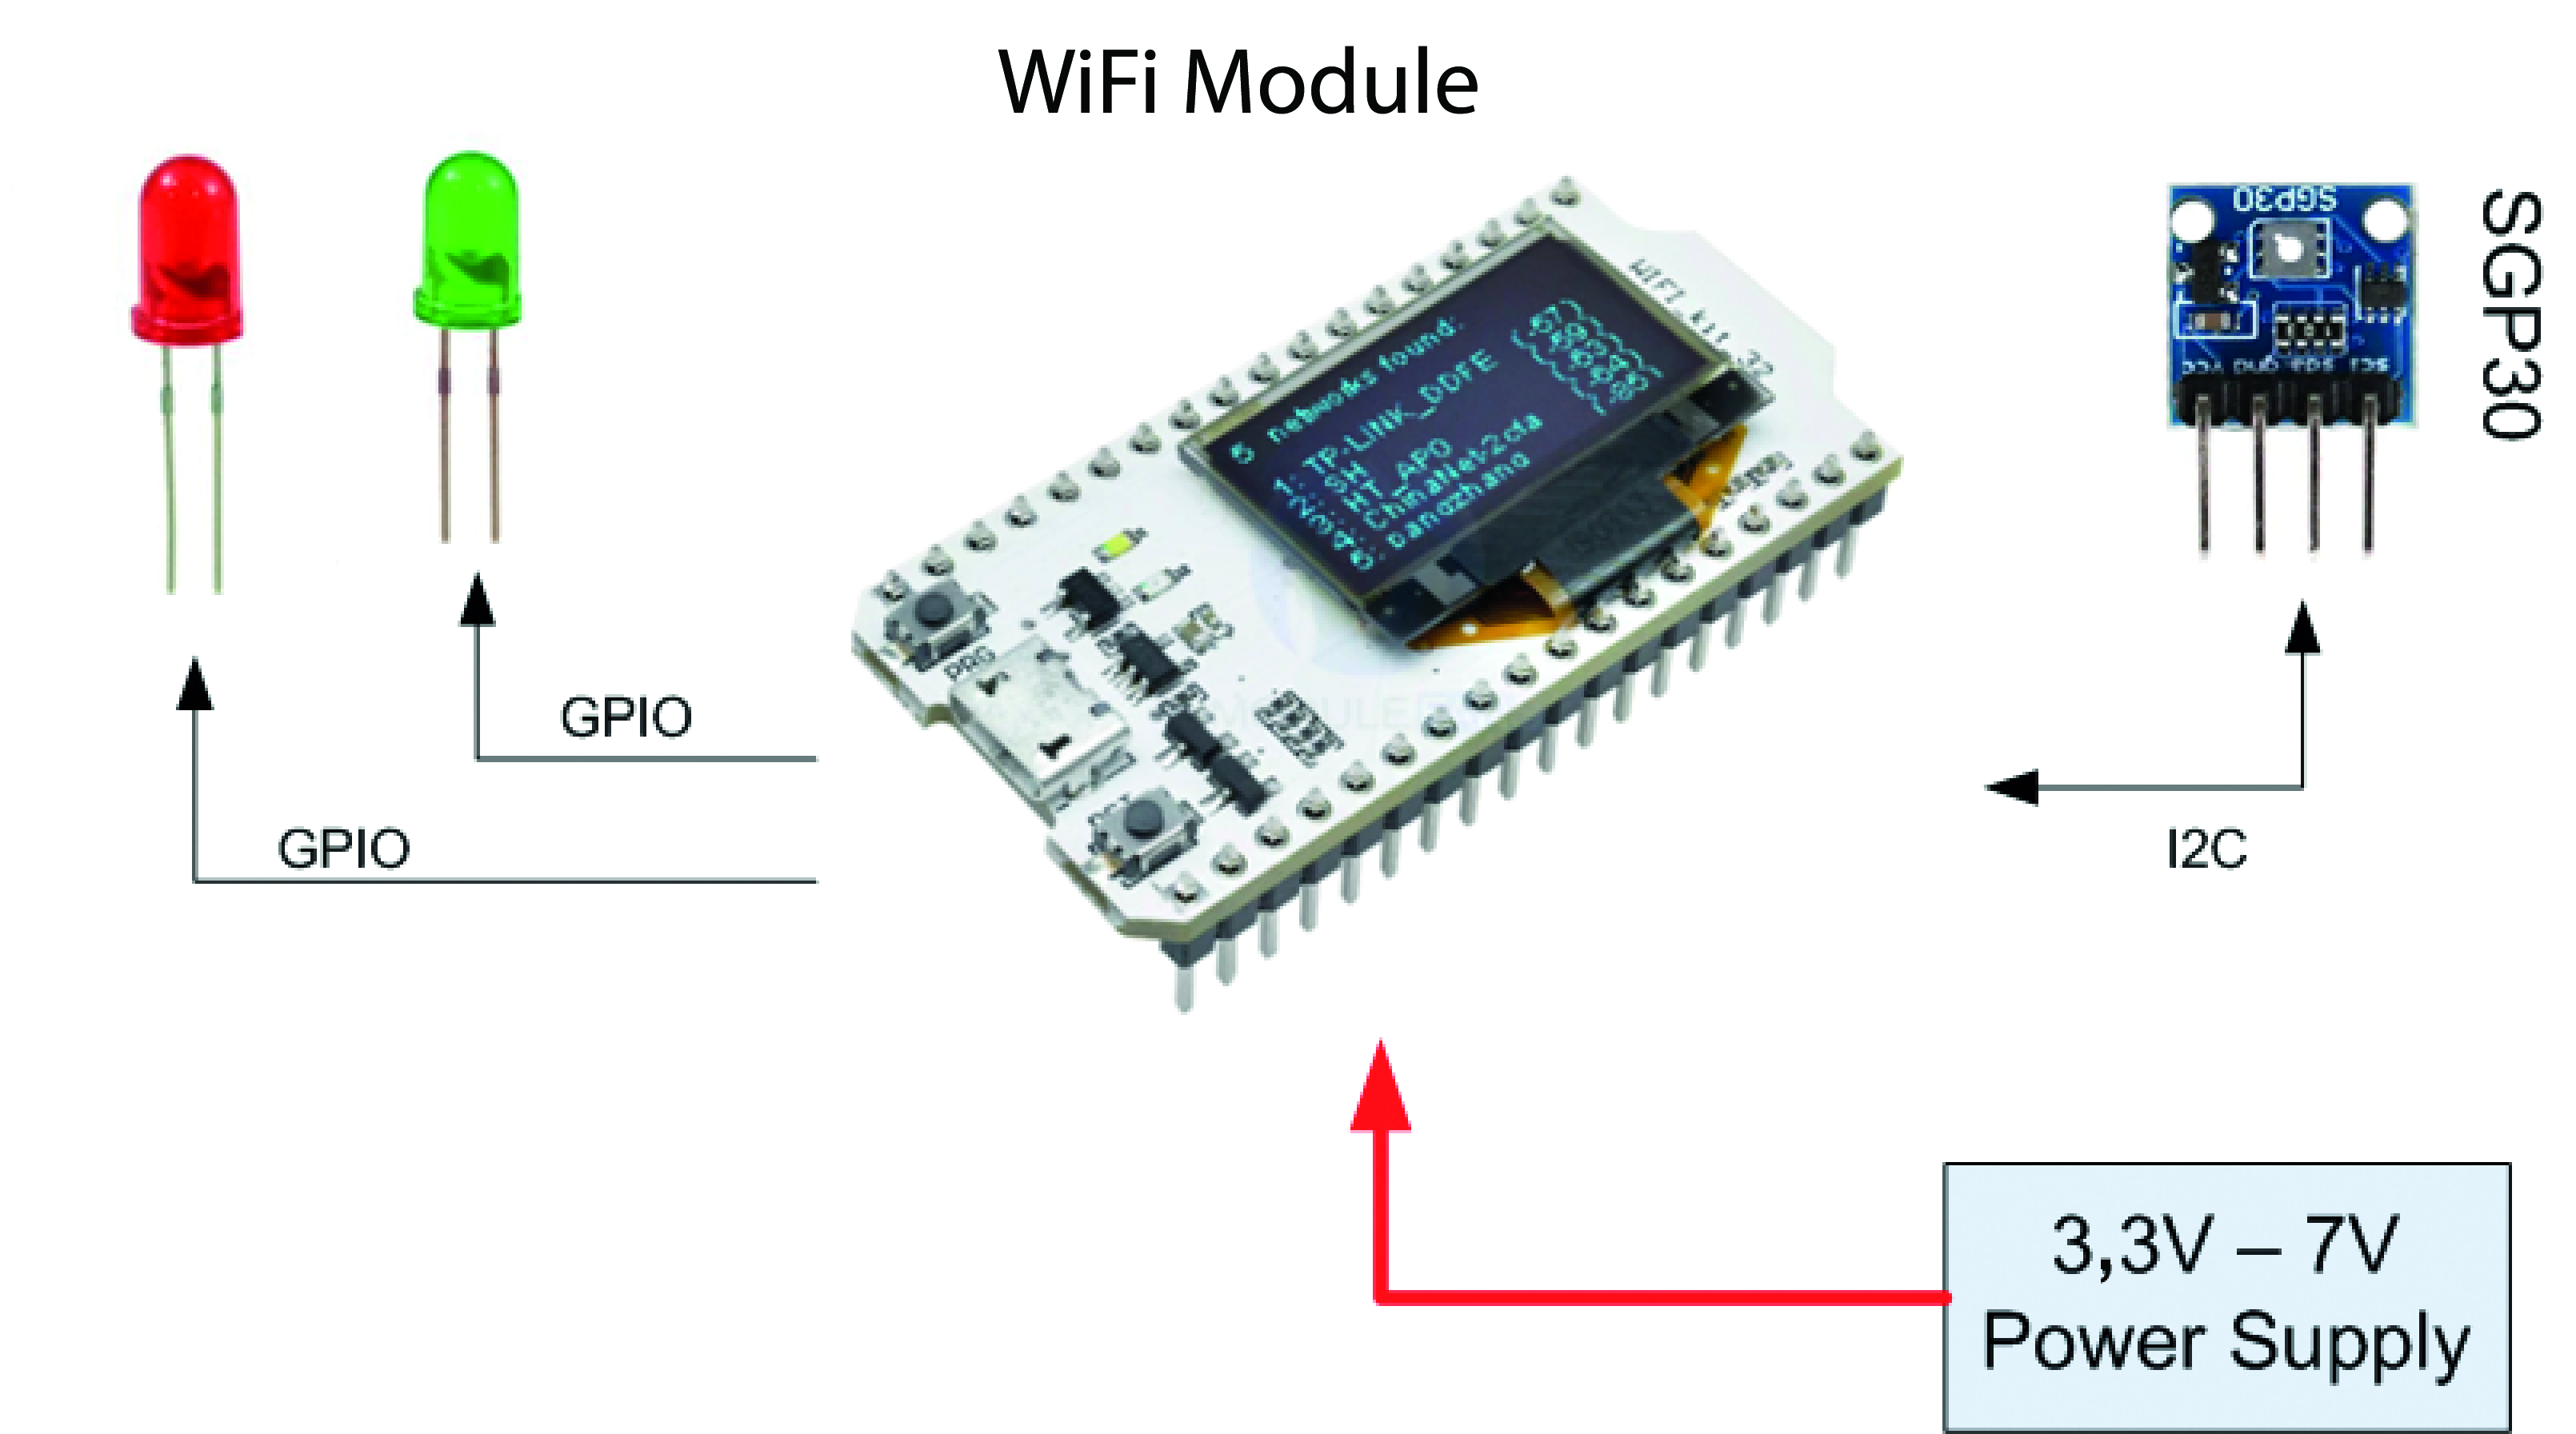
To realize the device we have introduced so far, we decided to use a Heltec WiFi Kit 32 module as the control unit, an SGP30 sensor from Sensirion as the carbon dioxide and TVOC concentration detector element, and two common LEDs (one red and the other green) as signaling elements. The conceptual scheme of the system is proposed in Figure 1.
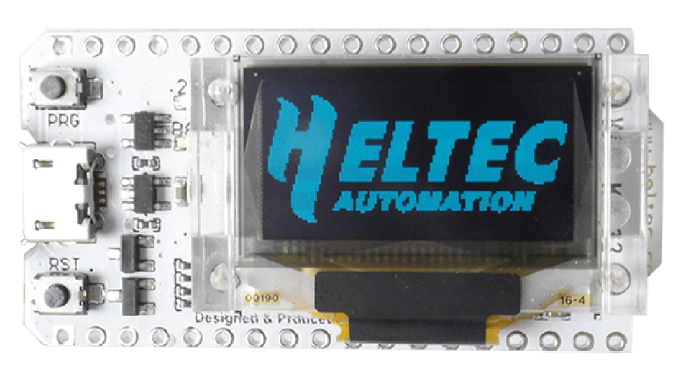
Heltec WiFi Kit 32 Module
The Heltec WiFi kit 32 module, which is ultimately the heart of our system, is a small electronic board that integrates an ESP32 microcontroller and a 0.96-inch OLED display; you can see it in Figure 2. The hardware features of the WiFi kit 32 module, which we will work with in this project, are:
- 0.96-inch blue OLED display;
- 32-bit Dual-Core Tensilica LX6 microcontroller;
- Clock frequency up to 240 MHz;
- 520 kB internal SRAM;
- 32 MB flash memory;
- Built-in 802.11 b/g/n Wi-Fi transceiver;
- Built-in dual-mode Bluetooth (classic and BLE);
- Power supply: 3.3 V to 7 V;
- 28 GPIOs (some used to manage the OLED display);
- Built-in lithium-polymer battery charger;
- Working temperature: -40 °C to +90 °C.
This module turns out to be perfect for our purpose, since it already integrates an OLED display that we will use for displaying air quality readings, and for user messages, as well as several GPIO channels that we need to control our signaling devices; in this first version we plan to use only two LEDs, but the amount of available GPIOs (28 in total) would easily allow us to add other elements, such as a buzzer, to produce acoustic signals. In addition to these features, the module has 520 kB of on-board RAM, and as much as 32 MB of Flash, features that allow us to be comfortable in terms of memory resources for our control software.
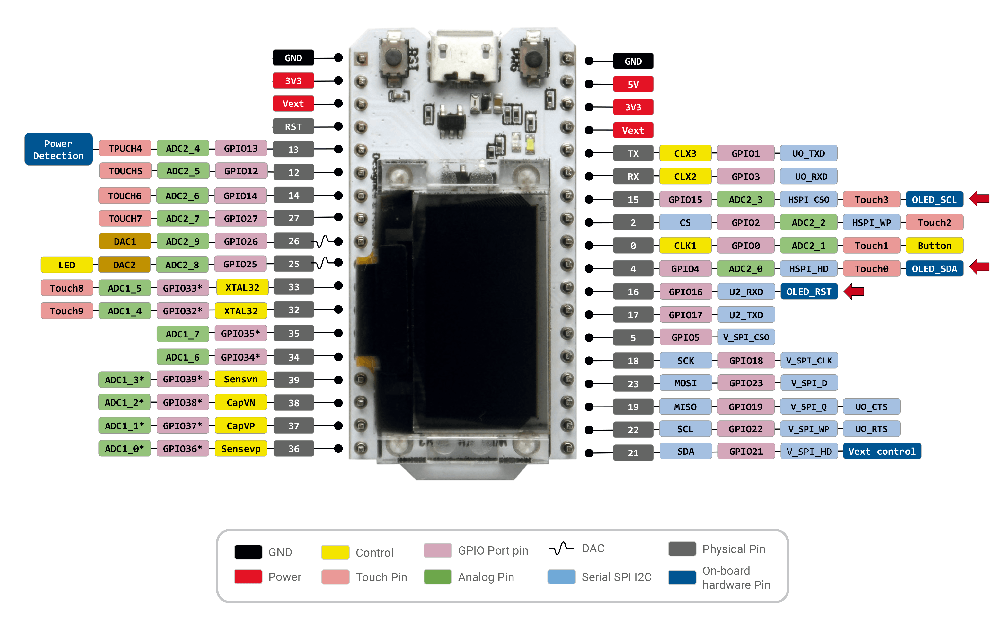
Furthermore, the module mounts a standard 802.11 WiFi transceiver, which we will be able to use for future evolutions of this device (for example, to publish data about CO2 and TVOC concentrations directly to a web page, or to send any alarms via Telegram), as well as a Bluetooth radio, which we will be able to use to interface with external devices, such as smartphones and PCs, which we can eventually use to configure the device itself. Finally, the board also integrates an on-board LiPo charger, which would allow us to associate a single-cell battery, which is very useful for providing power to the device even in the absence of line voltage. Figure 3 shows the pinout of our module.
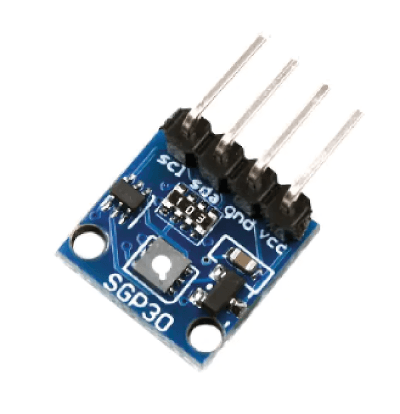
The SGP30 Sensor
To obtain the concentration of carbon dioxide and TVOC in the air, we decided to use a breakout board based on the SGP30 sensor from Sensirion. This tiny sensor, whose datasheet can be found here, allows us to know the concentration of carbon dioxide (to tell us how much the air in an enclosed environment is foul) and TVOC (Total Volatile Organic Compounds) i.e., the concentration in parts per billion of suspended particles. A picture of the breakout board is shown in Figure 4. The detailed hardware characteristics of the breakout board are as follows:
- Sensor: Sensirion SGP30 (TVOC and CO2);
- TVOC (Total Volatile Organic Compounds) detection: 0 to 60,000 ppb (parts per billion);
- CO2 detection: 400 to 60,000 ppm (parts per million);
- Sampling frequency: 1 Hz;
- Interface: I2C (address 0x58)
- Power supply: 3.3 V or 5 V.
Hardware Wiring
Let us now see how to make our apparatus in practice, starting with the physical construction and then the wiring of the components. The connection between the sensor board and the LEDs is basic, so much so that it can be done through male-female jumper wires like those for Arduino, or by relying on a breadboard, as you see on these pages. The SGP30 sensor is a breakout board interfaced via the I²C bus, so it needs a total of four connections since, in addition to the clock (SCL) and data (SDA) lines of the I²C bus, we also have to connect the two power lines (GND and the positive 3.3 V one).
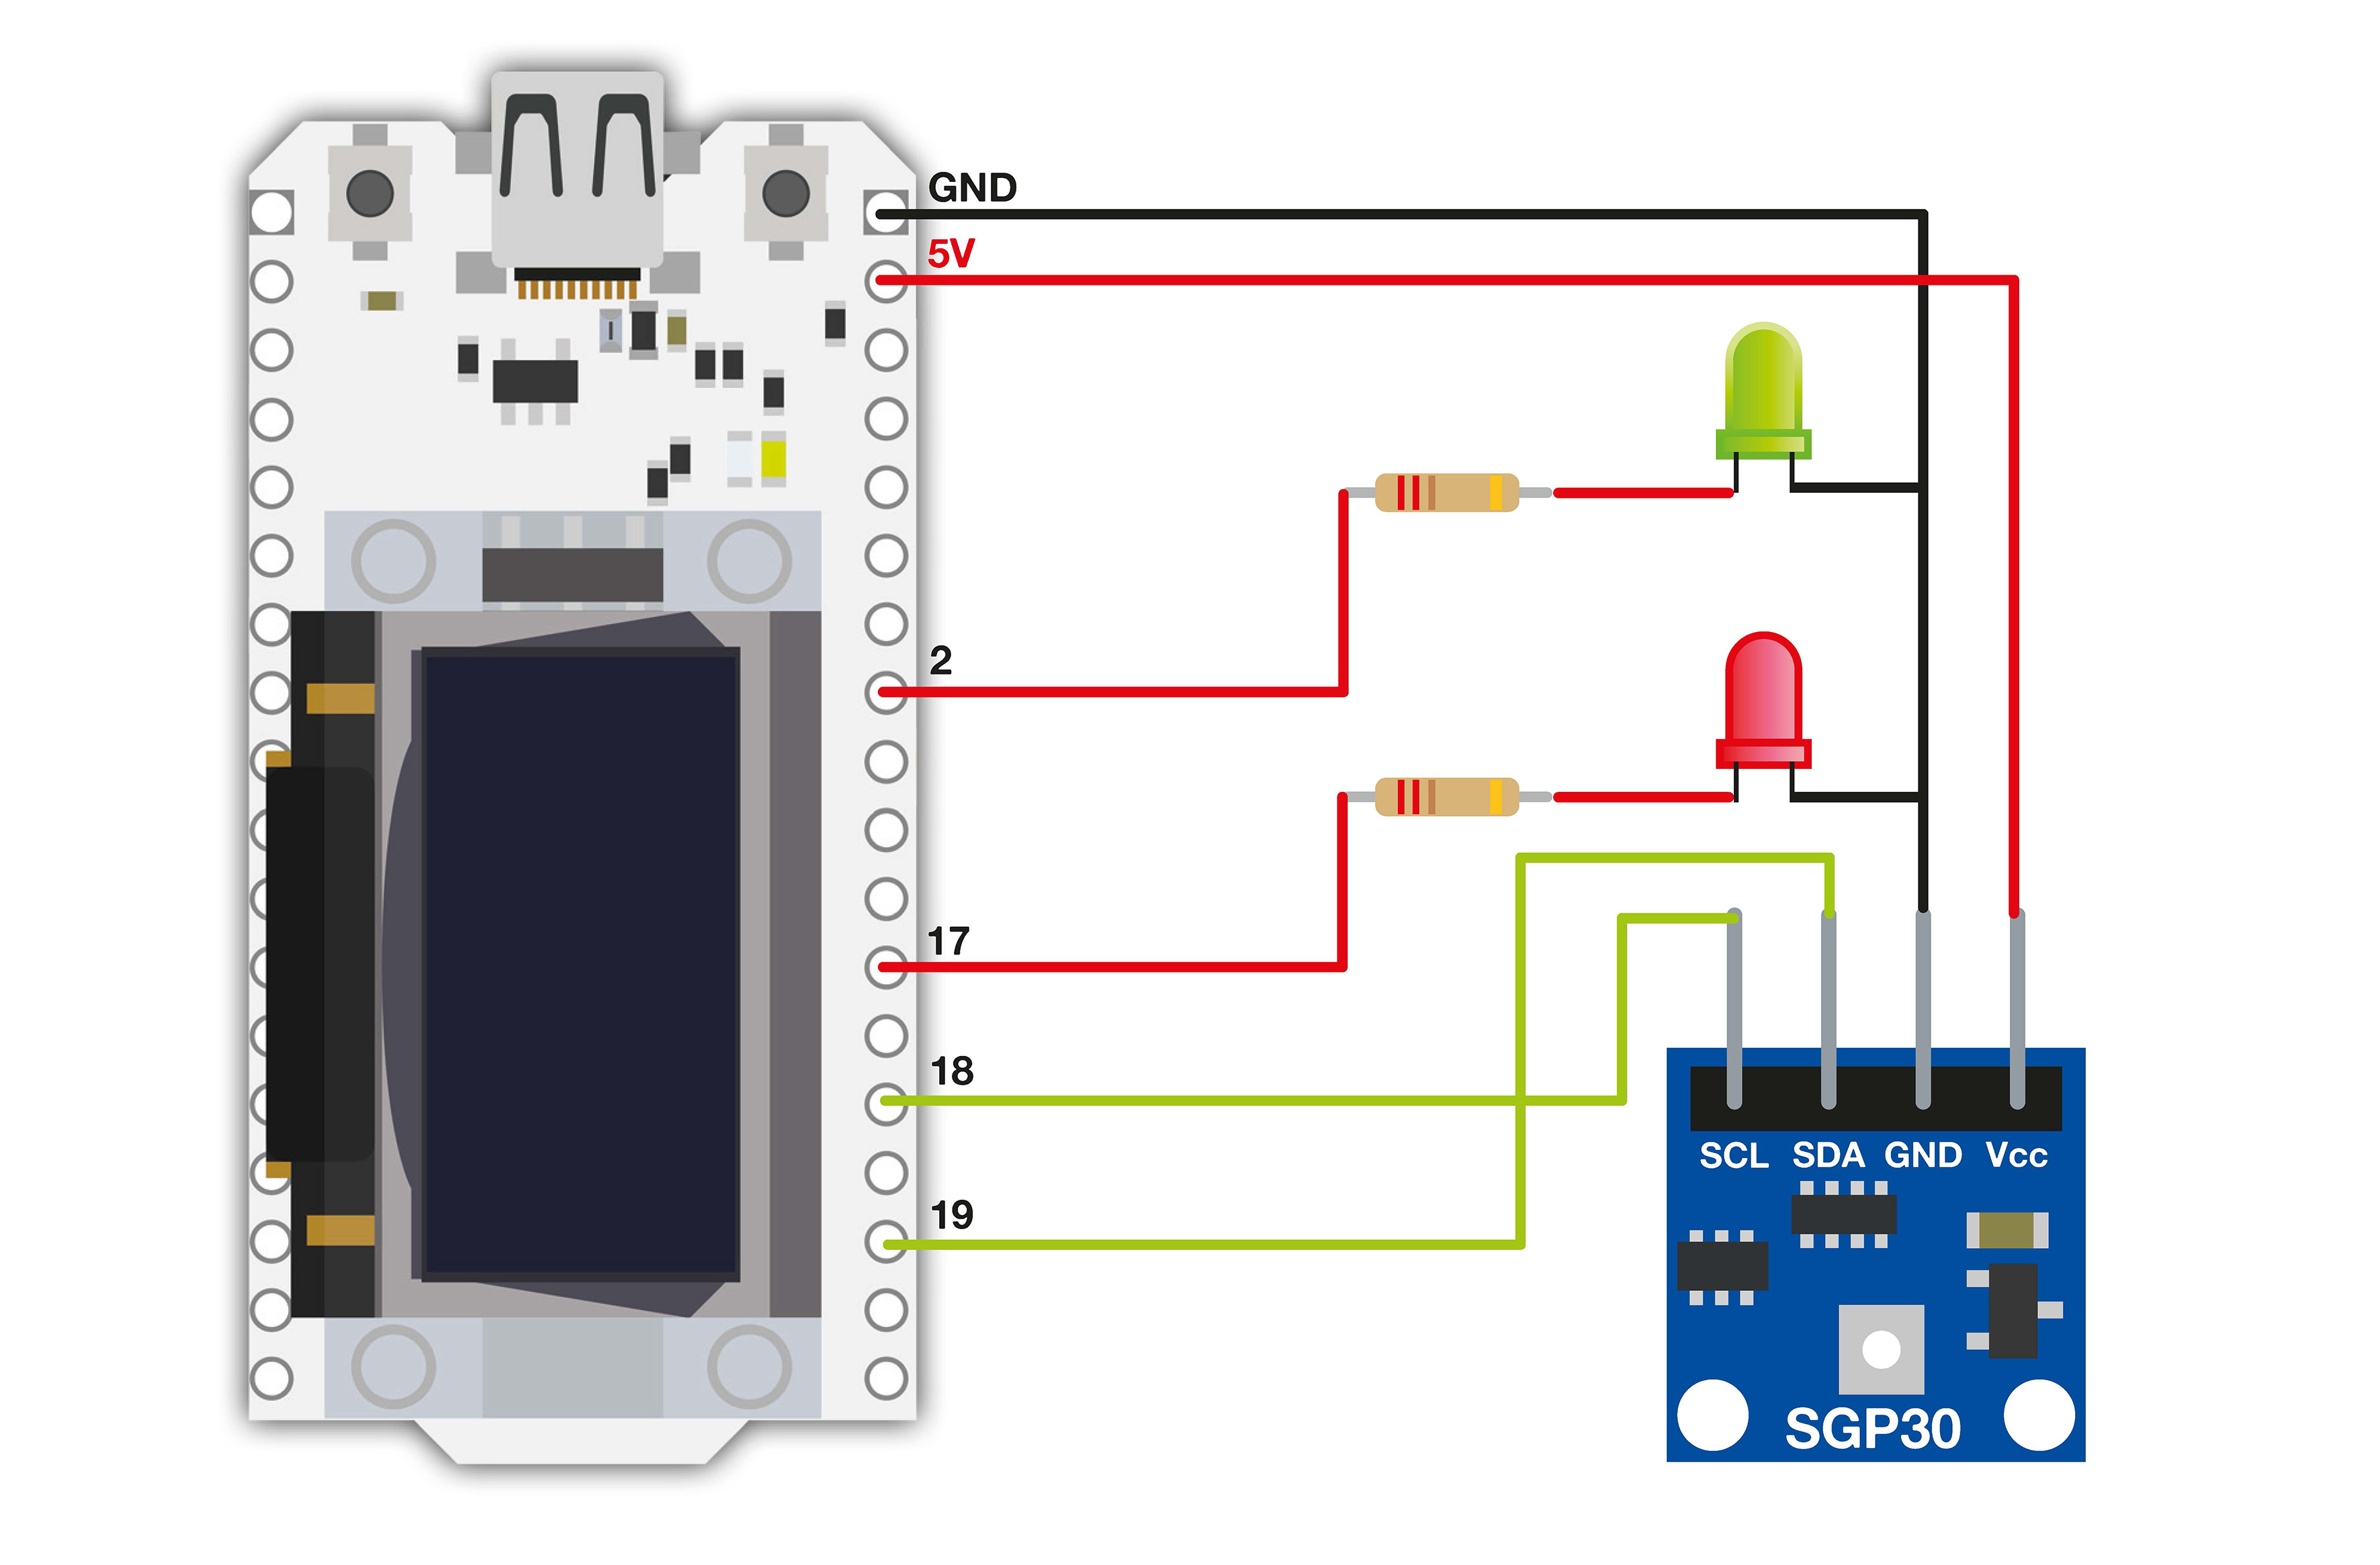
The two LEDs, on the other hand, are interfaced through two standard GPIOs from WiFi Kit 32 module. We need to place appropriate current-limiting resistors in series with these LEDs, which we have calculated to be 220 Ω each. To make it easier for you to make connections, on Figure 5 is shown the wiring diagram to be used if you want to interconnect the various elements via soldered leads or male-female jumpers. In addition, Table 1 shows the connections between WiFi Kit 32 module and SGP30 breakout board. Whereas, Table 2 shows the pins of WiFi Kit 32 module used for the two signal LEDs.
| Function | WiFi Kit 32 Pin | SGP30 Breakout Pin |
|---|---|---|
| SDA | 19 | sda |
| SCL | 18 | scl |
| Ground | GND | GND |
| 3.3 V | 3V3 | Vcc |
| LED | WiFi Kit 32 Pin |
|---|---|
| Green | 2 |
| Red | 17 |
Software Realization
After looking at the hardware details of our system, we move on to the Software. For the development of the control software, we decided to use MicroPython, and specifically the port for ESP32. MicroPython is a powerful system for software development of applications for modern, IoT-oriented microcontrollers such as the ESP32, and in addition, the large amount of existing libraries for handling sensors, actuators, and interfaces makes this stage of development much easier.
MicroPython Installation
To use MicroPython on WiFi Kit 32, the first thing to do is to install the interpreter, since WiFi Kit 32 does not have it by default. To achieve this, you must first obtain a version of the binary code to write to flash. The version used for the development of this application is v1.19 (2022-06-18). Download the Firmware and save it in a folder on your PC. At this point, you also need to equip yourself with esptool, a tool used to write the flash memory of the ESP32, distributed free of charge by Espressif (the company that manufactures the ESP32 and ESP8266). At this point, you need to erase the device memory and then flash the MicroPython binary.
Clearing The Memory
First connect the WiFi Kit 32 to your PC via a micro USB cable. The device should be associated with a virtual COM port (e.g., COM3, but the exact number depends on how many ports you already have on your system). Now put the board into programming mode by pressing and holding the PRG button and pressing and releasing the RST button. Now all you have to do is use the esptool.py script to clear the memory. You can put the script path in your system path, or you can operate directly from that folder and clear the memory with the following command (valid in Windows environment):
python esptool.py --port <port_numb> erase_flash
Replace <port_numb> with the virtual COM port assigned to your device (for example, COM3).
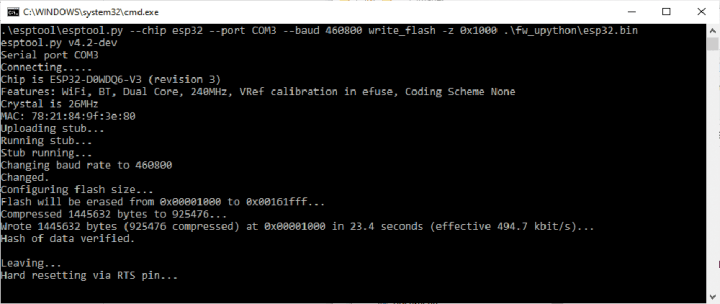
Flashing of The MicroPython Interpreter
At this point, you can flash MicroPython (in ESP32, the interpreter should be flashed at address 0x1000). You can use the following console command, again under Windows:
python esptool.py --chip esp32 --port <port_numb> --baud 460800 write_flash -z 0x1000 esp32.bin
As before, replace <port_numb> with the virtual COM port assigned to your device and esp32.bin with the name (and possibly the path, if it is not the same as the one you are operating from), of the binary you downloaded earlier. Figure 6 shows the result of this operation.
Control Software
At this point, we can move on to managing the control software for our board. As we mentioned, what we want to do is to acquire the data for CO2 and TVOC values provided by the SGP30 sensor, display this data on OLED display; read from file system the user thresholds for CO2 limit values (with associated hysteresis). Manage two indicator LEDs (red and green) to indicate if the CO2 level is above the maximum allowable threshold. To implement this software, we first need appropriate drivers to manage the OLED display and the SGP30 sensor. Fortunately, both drivers are available, developed by Adafruit. You can get them by downloading at the following links:
- For the OLED display driver
- For the SGP30 driver
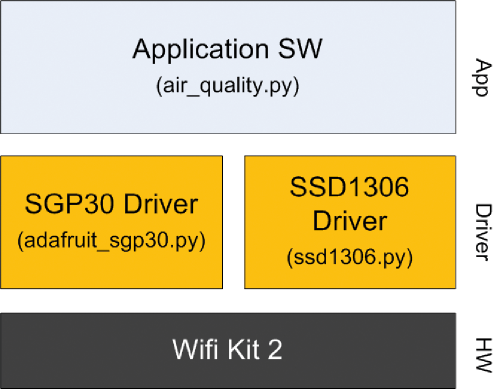
The architectural diagram of the software we propose to implement is shown in Figure 7. Thus, the complete project results in these three files:
- air_quality.py (main file of the application);
- ssd1306.py (OLED display driver);
- adafruit_sgp30.py (SGP30 sensor driver).
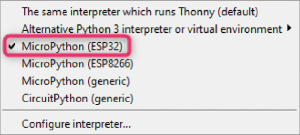
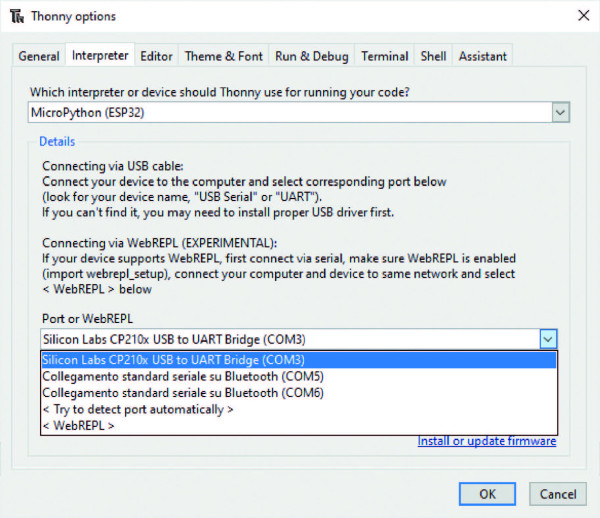
As the development IDE for this application, we will use Thonny, one of the most widely used IDEs for Python, which allows development of both standard Python and MicroPython applications. Thonny can be freely downloaded from here. Interfacing with MicroPython is very simple: after connecting the WiFi Kit 32 card to the USB port of the PC, open Thonny and click on the bottom right edge: in the drop-down menu that opens after clicking, among the various interpreters available select ESP32, as shown in Figure 8. If the interpreter should not be present, select Configure Interpreter… and manually indicate the interpreter and COM port to be used, as illustrated in Figure 9.
We now turn to the details of the application software, contained entirely within the file air_quality.py, which is broken down into two distinct phases:
- System Setup
- Main Loop
// - SYSTEM INIT
// -------------------------------------------------
// LEDs
led_green = Pin(2, Pin.OUT)
led_red = Pin(17, Pin.OUT)
led_green.on()
led_red.off()
// Initialize I2C buses
s_i2c = I2C(scl=Pin(18), sda=Pin(19), freq=100000)
d_i2c = SoftI2C(scl=Pin(15), sda=Pin(4), freq=100000)
// OLED enable pin
oled_sts = Pin(16, Pin.OUT)
oled_sts.on()
// OLED initialization
oled_width = 128
oled_height = 64
oled = ssd1306.SSD1306_I2C(oled_width, oled_height, d_i2c)
// Air quality sensor init
sgp30 = adafruit_sgp30.Adafruit_SGP30(s_i2c)
// Initialize SGP-30 internal drift compensation algorithm.
sgp30.iaq_init()
// Wait 15 seconds for the SGP30 to properly initialize
user_message(‘Sensor Init...’)
time.sleep(SENS_INIT_DELAY_S)
// User threshold for LEDs indication
get_user_threshold()
// Sensor Calibration
get_sensor_baseline()
// Store the time at which last baseline has been saved
baseline_time = time.time()
The first phase, as can be easily guessed from the name, constitutes the initialization phase of the system, while the second is the main loop in which measurement, printing of values on OLED display and status signaling via LEDs takes place. The first phase, the code for which is given in Listing 1, is responsible for initializing all the peripherals in the system, such as the LEDs, the two I²C buses (one used for interfacing the OLED display, the other for managing the SGP30 sensor), and for retrieving from the file system the values of the SGP30 sensor baseline and the user-set CO2 threshold. These files are text files that the software expects to find in the file system (see below). Sensor baseline values are calibration values that improve reading accuracy and are automatically created by the software if they are not present. Files containing the alarm threshold for the CO2 value, on the other hand, must be created by the user, and if not present, default values are loaded. The following two files must be created to set this threshold:
- co2eq_th.txt = contains the alarm value of the CO2 reading, in ppm (parts per million);
- hist_th.txt = contains the hysteresis of the previous threshold, again in ppm.
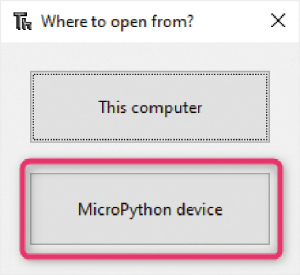
Creating these files is simple: in the Thonny environment, with the board connected via USB, select the file icon or File > New. Repeat this twice to create two files and write the values inside (e.g., 450 in the co2eq_th.txt file and 10 in the hist_th.txt file, so that you have a threshold of 450 ppm CO2 and a hysteresis of 10 ppm). Now click on the floppy disk icon (or select File > Save) and in the pop-up that appears, select Micropython Device, as shown in Figure 10. This will allow you to access the device’s file system and save the files you created earlier. This allows you to set the CO2 threshold value of the case. Once the initialization phase is completed, the software switches to the main loop, depicted in Listing 2.
// - MAIN LOOP
// ------------------------------------------------
while True:
// Get CO2 and TVOC data
co2eq, tvoc = sgp30.iaq_measure()
// Print values on Display
oled_data(co2eq, tvoc)
// Manage LEDs
if (co2eq > co2eq_th):
led_green.off()
led_red.on()
elif (co2eq < (co2eq_th - hysteresis)):
led_green.on()
led_red.off()
// Update sensor baseline
update_sensor_baseline()
// Wait for the new sampling time
time.sleep(SAMPLING_TIME_S)
Here, the following operations are performed in sequence. Through a iaq_measure() function of the adafruit_sgp30 library (sgp30_iaq_measure()), the CO2 and TVOC values are acquired and saved in the two variables co2eq and tvoc, respectively. At this point, in the next line, the values are printed to the OLED display, via the oled_data() function. Next, through a series of if...elif statements, the LED signaling is handled. Specifically, if the value stored in the co2eq variable is greater than the threshold co2eq_th, set by the user, then the red LEDs are turned on and the green LEDs are turned off; otherwise, if the value is less than the threshold value minus hysteresis (co2eq_th - hysteresis), then the red LED is turned off and the green LED is turned on. After this phase is finished, the update_sensor_baseline() function is invoked to update the sensor baseline.
To ensure optimal sensor operation, the software updates the baseline the first time after 12 hours of operation and then every hour, as indicated in the SGP30 manufacturer’s datasheet. At this point, the loop pauses for 60 s before running a new data acquisition cycle. The complete software project of this application, complete with description and all necessary MicroPython libraries, can be downloaded from the respective GitHub repository.
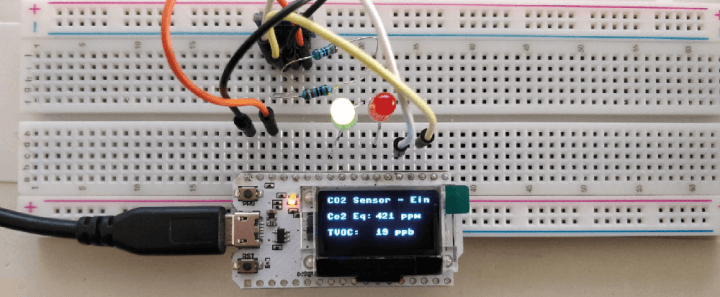
To test the software, you will have to save the two files containing the drivers in the memory of the WiFi Kit 32 card, using the same procedure as illustrated for saving the user files, being careful to keep the same file names, and not to forget the .py extension. The main file can be run directly from Thonny, or saved on the device memory by renaming it main.py, a necessary expedient if you want to run the device in “standalone” mode, i.e., not connected to the PC (in fact, the main.py file is the file that is automatically searched by the MicroPython interpreter at startup). A picture of the device wired on a breadboard as it acquires air quality data and activates the LEDs is proposed in Figure 11.
Configuration
The software also has some configuration options that can be modified by the user, all found in the air_quality.py file. Specifically, it is possible to change the default values of the CO2 alarm threshold and its hysteresis by modifying the two parameters co2eq_th and hysteresis, which are set to 450 and 10 by default, as depicted in Listing 3 (acting on the default values does not require saving the values of these two parameters to the file system). You can also change the initial waiting time for sensor stabilization and the sampling time (SENS_INIT_DELAY_S and SAMPLING_TIME_S), set by default to 15 and 60 s, as also represented in Listing 3 (we suggest, however, not changing these settings).
// - USER TH DEFAULT VALUES
-------------------------------
co2eq_th = 450
hysteresis = 10
-------------------------------
// - TIMING CONST
// -------------------------------
SAMPLING_TIME_S = 60
SENS_INIT_DELAY_S = 15
Wrapping Up…
In this article, we have described in detail the implementation of an air quality monitoring device. By reading an air quality sensor (SGP30), it can show CO2 and TVOC concentrations on a display. Furthermore, by reading a user file containing the tolerance threshold for CO2 concentration, it can visually signal via an LED to operate an air exchange in the room. Given the wealth of additional peripherals in the platform used, it is possible to expand this device with IoT functionality, such as a web page that allows remote data consultation and alerts via e-mail or telegram notification.
Component List
Modules
- 1 × Heltec WiFi Kit 32
- 1 × Sensirion SGP30
LED
- 1 × Red, 5 mm, High Efficiency
- 1 × Green, 5 mm, High Efficiency
Resistors
- 2 × 220 Ω, 0.25 W, 5%
Editor's notes: This project originally appeared in Elettronica IN.
Discussion (0 comments)