
ESP32-Based Weather Station: Get Accurate Forecasts Without Installing Any Sensors
on

The installation of a weather station usually requires the fitting of a set of dedicated sensors on the roof, which, for various reasons, is not always possible. This project, featuring an ESP32, solves that problem by accessing the OpenWeather service over a Wi-Fi connection.
Predicting the weather for tomorrow, the day after, or as far ahead as possible has always been a major human aspiration. This led to the development of Meteorology. The interest in this field grew significantly towards the end of the last century, thanks to the availability of dedicated websites and affordable home weather stations that are easy to install.
A weather station is a system that, using a few sensors mainly for humidity, atmospheric pressure, rainfall, and wind speed and direction, can provide current conditions and forecasts. This is done either through local algorithms or by accessing databases and servers on the web. Recently, weather stations have also been defined as devices that do not collect environmental data themselves but display information sourced from the internet, including meteorological sites or data from registered users.
The ESP32-S3-Based Smart Display
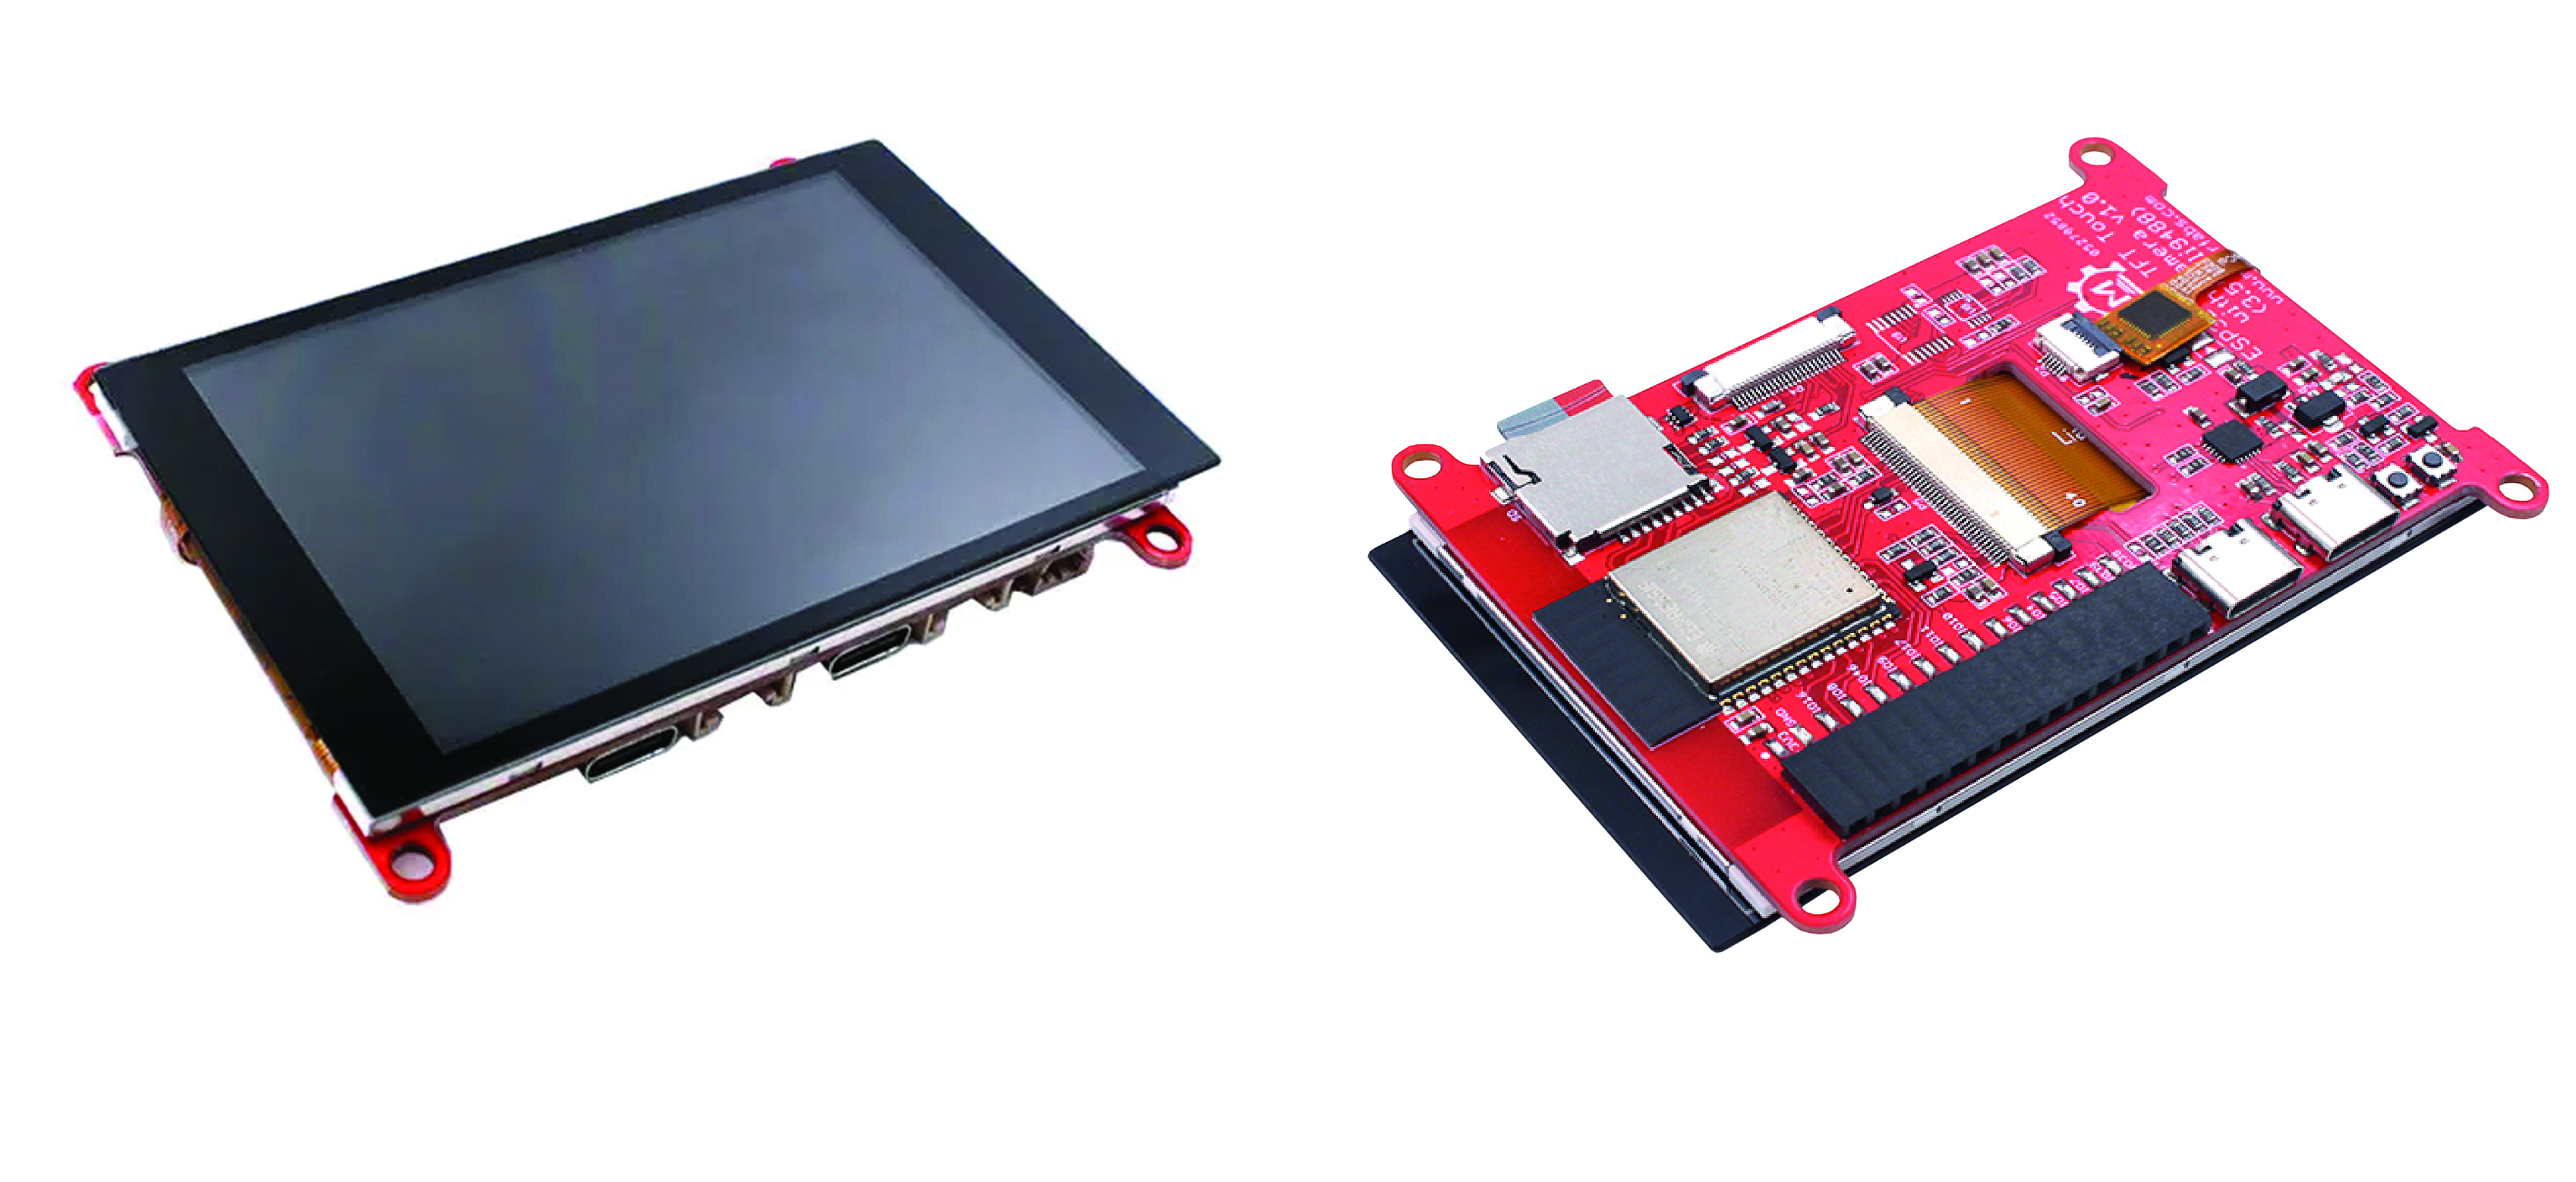
The module for this weather station project is a 3.5-inch TFT smart display, with capacitive touchscreen and ILI9488 graphics controller. The latter is interfaced to the ESP32-S3 module, which has a microSD card slot on board to load the program to be executed. The controller uses a 16-bit parallel bus for communication with the ESP32-S3 and can operate at clocks up to 20 MHz, allowing very smooth video playback.
Features of the module are listed below.
- Controller: ESP32-S3-WROOM-1, PCB antenna, 16 MB flash, 2 MB PSRAM, ESP32-S3-WROOM-1-N16R2
- Wireless: Wi-Fi and Bluetooth 5.0
- LCD: 3.5-inch TFT LCD
- Resolution: 480×320 pixels
- Color: RGB
- LCD interface: 16-bit parallel
- LCD driver: ILI9488
- Sensor: capacitive touch
- Touch panel driver: FT6236
- USB: Dual USB Type-C (one for USB-to-UART and one for native USB)
- UART to UART chip: CP2104
- Power supply: USB Type-C 5.0 V (4.0 V…5.25 V)
- Buttons: Flash button and Reset button
These Internet-connected weather stations, though less independent than offline ones, offer two main advantages: They eliminate the need to install equipment such as anemometers and rain gauges on roofs or balconies, and they are more affordable. This inspired the idea for our project: a simple, compact weather station made possible by devices such as smart displays or smart panels, based on ESP32 SoCs, which are now widely available. One such device, the 3.5″ TFT Display with ESP32-S3 from Makerfabs, particularly caught our attention and is used in this project. It’s available at the Elektor Store.
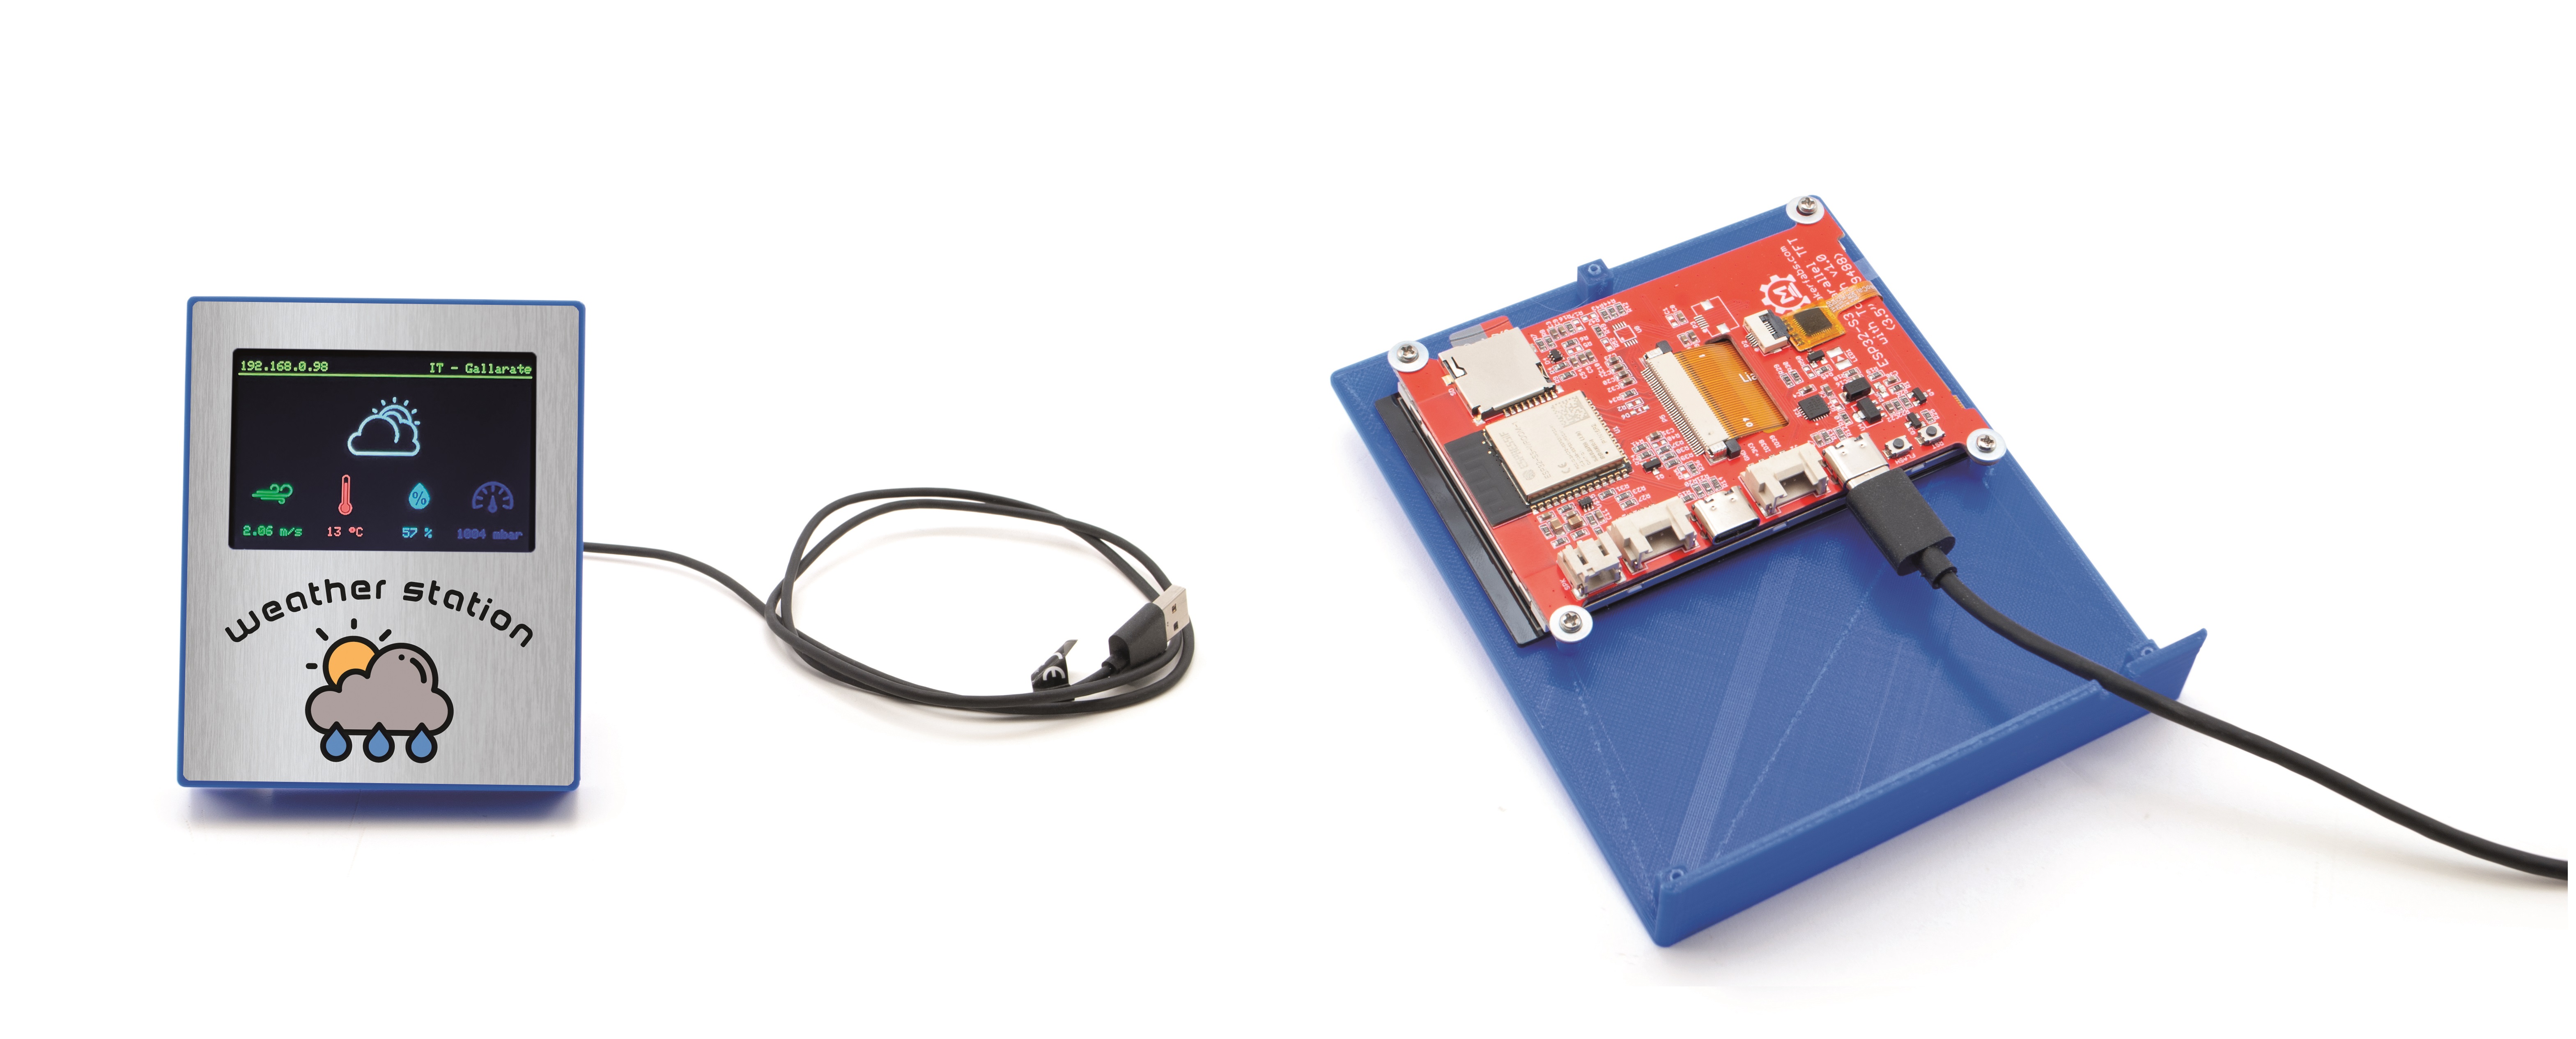
This module is a 3.5″ smart TFT display, integrating an ESP32-S3 operating at 2.4 GHz, with I2C, I2S, SPI, PWM, UART, and USB interfaces. It also includes two USB-C ports, an SD card slot, and notably, Wi-Fi and Bluetooth connectivity. Figure 1 shows this module from both sides. Equipped with a microprocessor, the display can be programmed as desired by loading firmware onto an onboard SD card. This allows for extensive customization and interaction with the external world.
What makes this device even more appealing is that it belongs to the ESP32 family and can be programmed using the Arduino IDE environment. This allows for the use of the LovyanGFX library, a crucial tool for interacting with the screen. We will explain in later pages how to make this library available in the IDE using Library Manager. The version of the library used in this project is 1.1.2. Utilizing this library is quite straightforward: You create an LGFX object, initialize it, set some parameters (which we will discuss later), and it then becomes the “canvas” for your display needs. An example can be seen in the code contained in examples/HowToUse/1_simple_use/1_simple_use.ino found in the LovyanGFX library.
The Weather Station Project
In this weather station project, we built a small desktop/wall weather station using this high-performance smart display. It leverages the API of the OpenWeather web service to retrieve daily forecasts for a specified location. The station includes a microSD card for configuration data, allowing users to modify settings without reprogramming the firmware. They can simply use an external SD card reader to change parameters such as Wi-Fi network access details, operating mode (DHCP or static IP), openweathermap.org user parameters, city ID, and weather data refresh timing.
The project essentially serves as a visualizer. Thanks to the ESP32-S3 SoC, it connects to the internet via onboard Wi-Fi and gathers necessary data from the aforementioned web service.
Getting the Weather Data
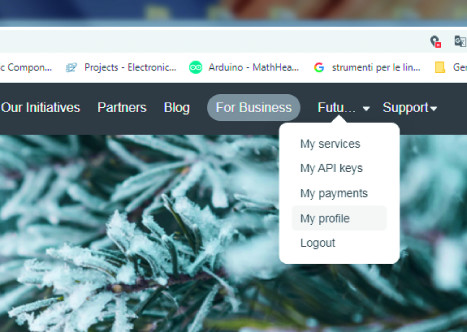
For the Electronic Control Unit (ECU) to function properly, it must first acquire data. To achieve this, the initial step is to register with the OpenWeather service to obtain an API key and all relevant information for code implementation. After registration, you’ll need to access the registration area of the website and complete the process as directed. Once registered, you can access your personal area by clicking on My Profile (Figure 2).
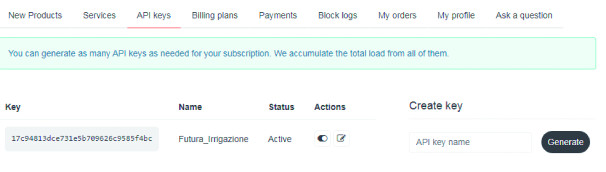
In the My API keys section, you’ll find a default key. However, we recommend deleting it and creating a new one with a more descriptive name, indicating its use. For example, we created one named Futura_Irrigazione and generated it by entering this name in the API key name field and clicking the Generate button. After this, you’ll find yourself in a situation similar to that shown in Figure 3, where the Key field will be different from the one shown, as each one will be unique.
Keep the API key you create, as you will need it later when configuring the microSD Card. After generating the key, you’ll receive an email stating that it will take a few hours for the key to be activated. This means that if you try to use the service immediately, the openweathermap.org server will only return an error message.
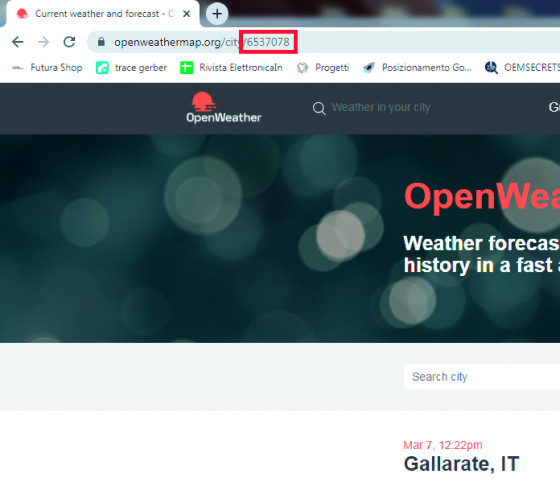
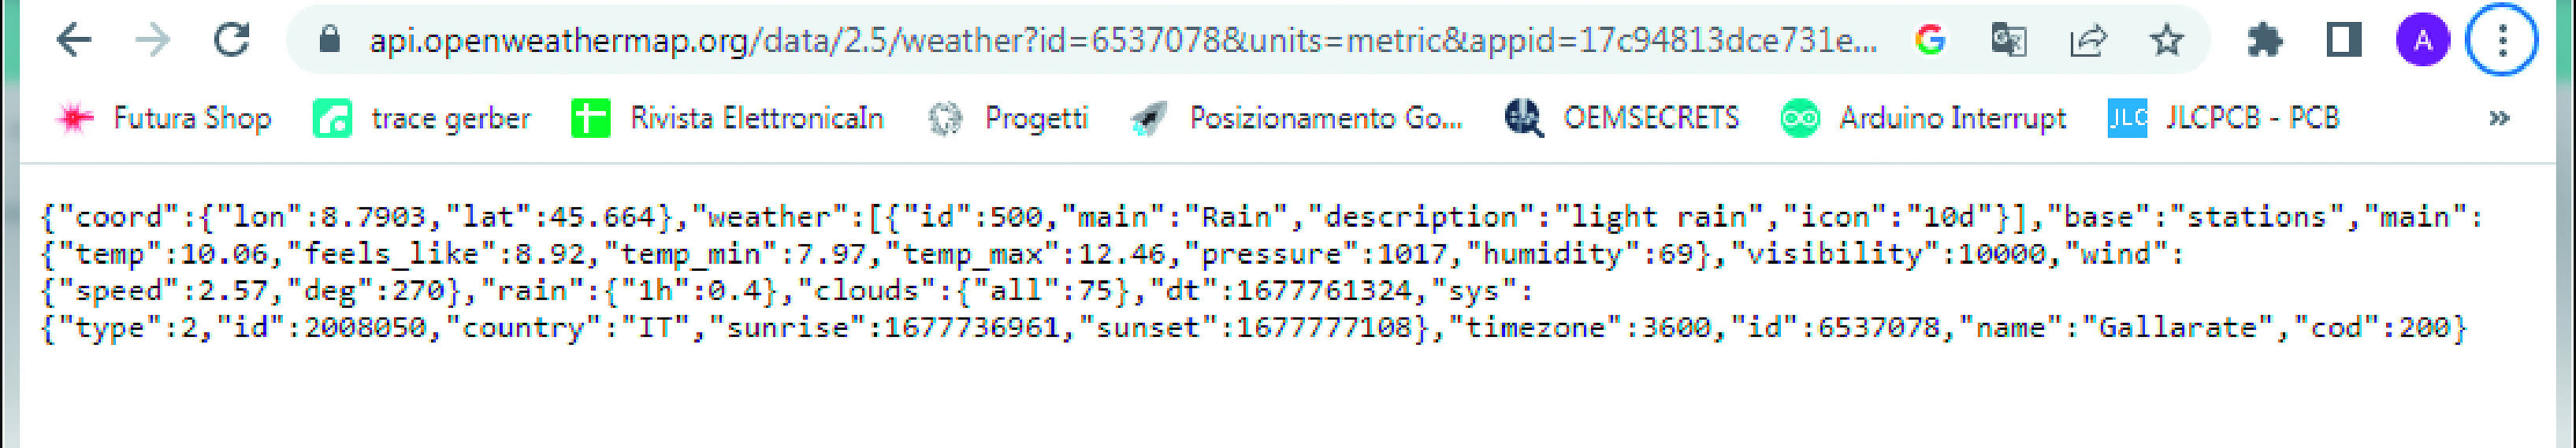
While waiting for key activation, you can proceed to retrieve your city’s ID, which is necessary for weather information. To do this, click on the site’s logo to return to the home page, then enter the name of your desired city in the Search city field, click on the Search button, and select the city. The city ID will then appear as part of the URL in your browser’s address bar. In our case, the ID is 6537078. Save this ID for later configuration. Figure 4 shows the address bar when our example, Gallarate, was the selected city. To verify that the API is active, open your browser and paste the following link, replacing APIURL and CITY with your respective identifiers. In our example, the link would be:
https://api.openweathermap.org/data/2.5/weather?id=6537078&units=metric&appid=17c94813dce731e5b709626c9585f4bc
The expected output is illustrated in Figure 5.
With the web part completed, we can now focus on the control code to be loaded onto our hardware. However, it’s worth discussing the API first. We haven’t mentioned the cost of the service as it’s free for the project’s scope, but OpenWeather offers various plans with different features, which can be activated as needed. For example, to request a four-day forecast or receive weather alerts and statistics, you can activate the relevant plan by going to the API page (from the site’s navigation bar), which involves a subscription.
microSD Preparation
As anticipated, the module hosts a microSD Card, inside which the config.ini file must be created. This file contains all the data related to the configuration of the device, including those for accessing the Wi-Fi network, as well as the necessary details to connect to the weather service via API. Figure 6 offers an example of the contents of a file based on what was reported on the previous pages.

The [Network] section contains the following data:
| SSID | Wi-Fi network name |
| PWD | Wi-Fi password |
| IP | Desired IP address for static IP configuration. Leave empty for DHCP. |
| Gateway | Desired gateway address for static IP configuration. Leave empty for DHCP. |
| SubNet | Desired subnet mask for static IP configuration. Leave empty for DHCP. |
| DNS1 | Desired primary DNS address for static IP configuration. Leave empty for DHCP. The secondary DNS address will default to that of the gateway. |
The [Country] section includes the city ID from openweathermap.org and the refresh rate for weather data. Lastly, the [API] section should contain your created API key. Remember, it takes about two hours for the key to activate. Create and copy this file to the microSD card. Note that the filename is case-sensitive. You can change the data at any time, but it’s only read during the device’s boot-up phase, so if you make changes, you’ll need to power cycle the device for the new parameters to be applied.”
The Arduino Sketch
Let’s now describe the weather station management code, which can be downloaded from our website and loaded directly through the Arduino IDE without changes, as all configurations are made on the microSD. A note about the weather icons displayed on the GUI: Although the code is ready to use, you might want to modify some icons. These are not read directly from the microSD, but are embedded in the sketch’s program memory. For this, we used a third-party service called image2cpp, which converts JPEG images to program code. Each weather icon must be embedded in the code in a 128×128 pixel format, while icons for wind speed, temperature, humidity, and atmospheric pressure are in a 64×64 pixel format.
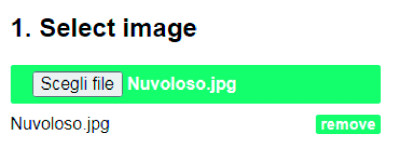
Let’s see how to change an icon within the GUI using the image2cpp tool. First, you need to find or create an icon of at least 128×128 pixels. Once you have the image, at the Select Image step, use the Choose File button to select your desired file (Figure 7). Then, move to the next step to set the output format of the image. Considering that the display’s background is black, the new icon’s background should preferably be black too.
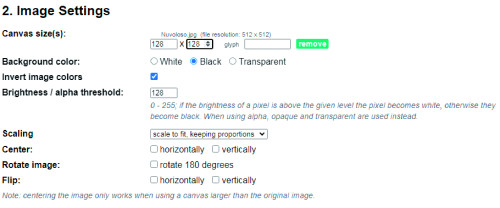
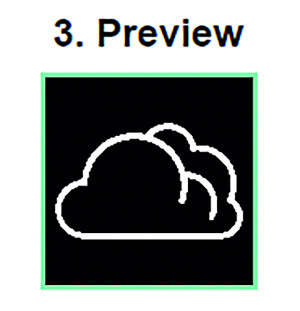
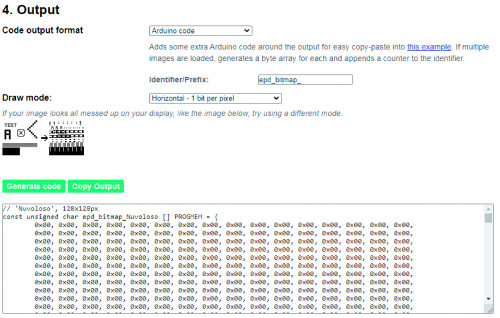
In the Canvas size(s) section, set the size to 128×128 or 64×64, depending on the icon you want to change, and select Black as the background color (Figure 8). It’s important to set the automatic scaling of the image while maintaining proportions. After making these settings, a preview based on your input will be visible (Figure 9). If the icon meets your expectations, you can then click on the Generate code button after selecting Arduino code as the Code output format. Copy the part included between the braces to be pasted into the Arduino sketch later (Figure 10).
Open the Arduino IDE (version 1.8.9 was used), and then open the sketch downloaded previously, by selecting the file StationWEB_TOUCH.ino. Open the code there will be two files, so select the one called weathericons.h and locate the icon to be changed and paste the code copied earlier between the curly brackets. The same procedure can be repeated for any icon you wish to go to vary from the default settings. Now that the code has been customized, all you have to do is load it onto the control board, which is then all the constituent hardware of the weather station.
Loading the Sketch via Arduino IDE
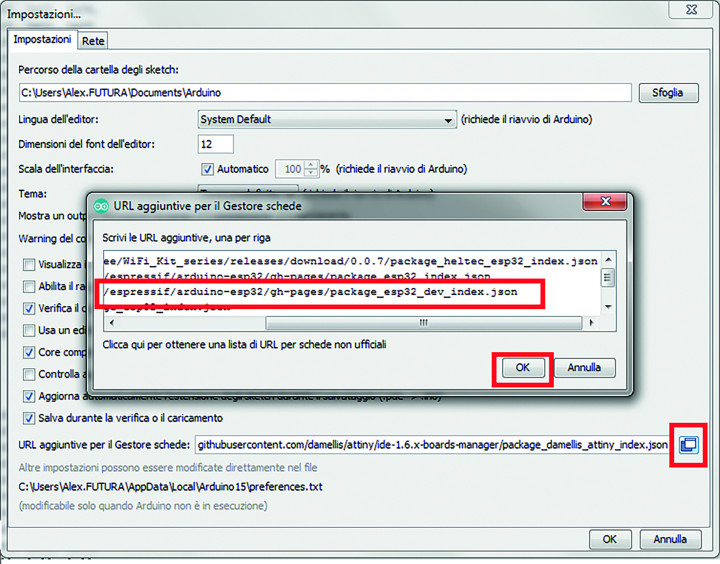
Before loading the code, you must complete some preliminary steps, including installing libraries in the IDE and loading third-party board drivers. If you haven’t done this yet, start the Arduino IDE and go to File → Preferences. Add the following link for board installation:
https://raw.githubusercontent.com/espressif/arduino-esp32/gh-pages/package_esp32_dev_index.json
After adding the link, click OK to confirm the configuration (Figure 11).
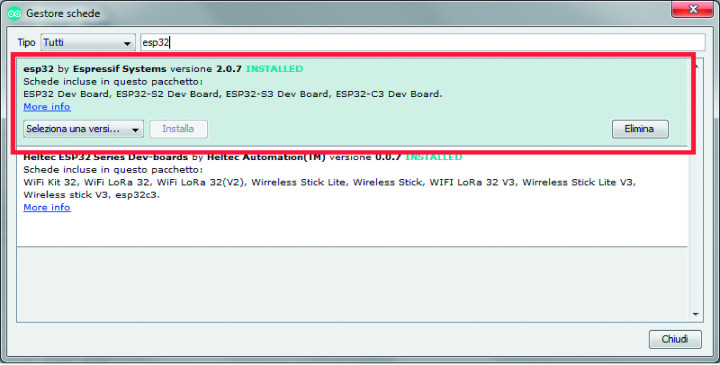
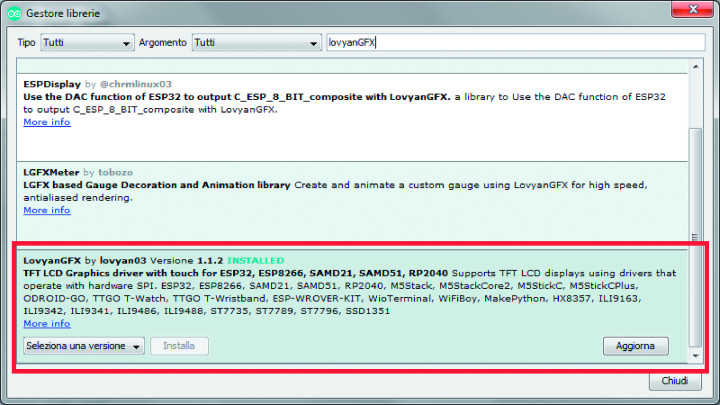
Navigate to Tools → Board → Board Manager in the Arduino IDE, search for “ESP32” and wait for the search results. Select Espressif Systems with version 2.0.7 and click Install to install the display board drivers (Figure 12). The final installation step involves adding the LovyanGFX library. Go to Sketch → Include Library → Manage Libraries and search for “LovyanGFX.” Be patient during the installation due to its considerable size, which may slow down the process (Figure 13). Remember to install version 1.1.2 of the library to avoid any compatibility issues during compilation.
Now, finally everything has been installed, so unless it has been done before, all that remains is to open the source code from the File → Open menu by opening the file StationWEB_TOUCH.ino which will also automatically open the .h file containing all the icons mentioned a few lines ago. From the Tools → Tab menu, select ESP32S3 Dev Module. Finally, it is time to connect the board to the computer, using a Type-C cable connected to the USB-TTL port on the display. If this is the first time you connect it, the driver will be automatically installed, but should an error message appear during the operation, you can use the driver available for downloading.
Once completed, you will get a virtual serial port, in our case COM197, which must be chosen from the Tools → Port menu. Everything is ready to load the code inside the display, but first remember to insert the microSD prepared earlier into its slot. Once this is done as well, you just need to click on the load button at the top of the Arduino IDE toolbar (the one with the arrow on the right). As soon as the loading has started, as indicated in the message shown at the bottom of the IDE window, press and hold simultaneously the RST and Flash buttons located behind the display, then release the RST button and as soon as the loading sequence begins (a condition indicated in the same area of the IDE by the message Connecting… as in Figure 14), release the Flash button as well.
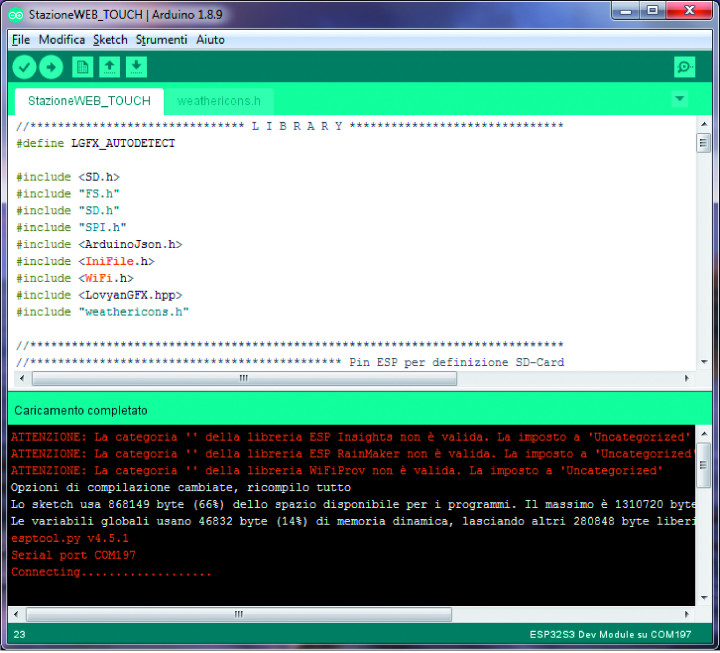
Programming will be started (you’ll be able to tell by the progress percentage that appears to the right of the orange lines beginning with Writing…, at the bottom of the IDE window). Upon completion of programming, the display with ESP32 is ready to operate as a weather station. You can now disconnect it from the computer and place it in any housing you like, such as the one suggested in Figure 15. As for the power supply, provide it via a 230 VAC/5 VDC mains power supply with USB type C connector.
Editor’s notes: Interested in ESP32 and DIY projects? This project originally appeared in Elettronica IN.


Discussion (0 comments)