
Simple 7-Band Audio Spectrometers
April 16, 2019
on
on
This project has two main components, one is a graphic equalizer IC type MSGEQ7 from MSI which is capable of dividing the audio spectrum into seven bands: 63 Hz, 160 Hz, 400 Hz, 1 kHz, 2.5 kHz, 6.25 kHz, and 16 kHz. The other is the familiar ATMega328P-AU microcontroller, programmed here to convert the MSGEQ7’s output signals into drive signals for a small OLED display.
Spectrum, spectra, spectro…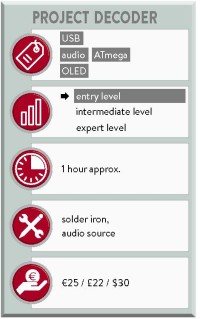
A spectrogram is a visual representation of the relative weight, within the audio spectrum, of certain frequency bands “distilled” from a composite sound or other signal, as it varies in time and volume. Spectrograms are sometimes called spectral waterfalls, voiceprints, or voicegrams.There are many variations of the format; one commonly seen is a graph with two geometric dimensions, one axis representing time or RPM (revolutions per minute) and the other axis, frequency. A third dimension is added to indicate the instantaneous amplitude of the components within a particular frequency band.
Theory of operation: two versions
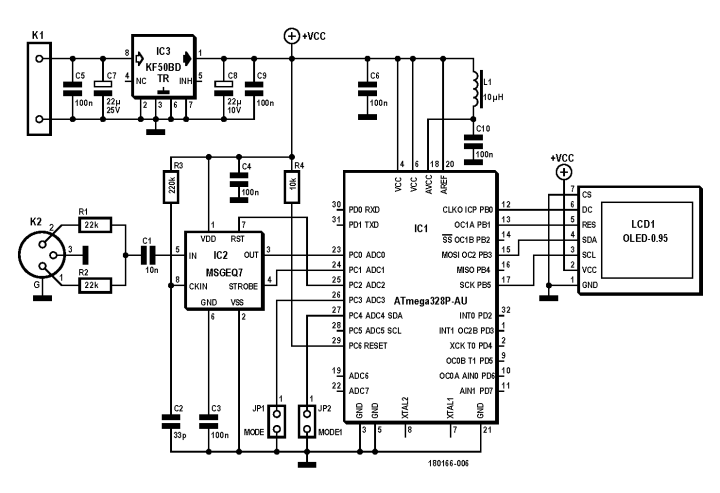
The circuit diagram of the spectrometer designed for ‘wall wart’ powering (i.e. from an 8-12 VDC source) is given in Figure 1.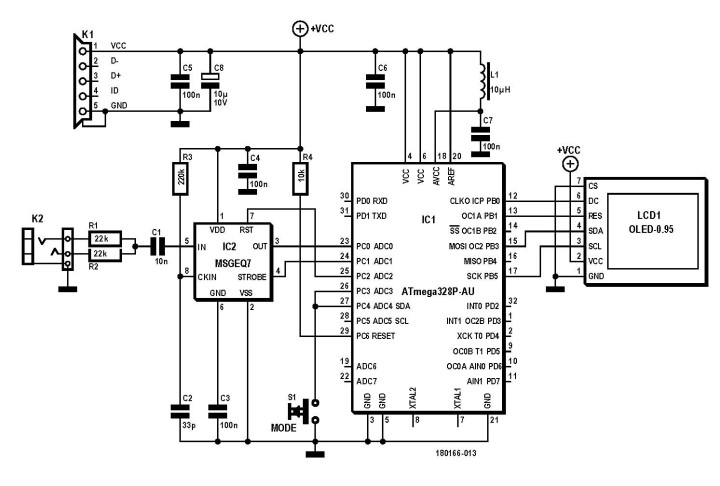
Version 180166-1 as it shall be called from here on is suitable for installing inside a loudspeaker or audio amplifier. Line-level stereo audio arrives through K2 and is made monaural with R1 and R2 before being applied to the spectrum analyzer chip through C1.
Inside MSGEQ7, the seven frequencies mentioned above are peak-detected and multiplexed to the output to provide a direct-voltage representation of the amplitude of each ‘band’. No external components are needed to select the (bandpass) filter responses. R23 and C2 are needed to determine the on-chip clock oscillator frequency. The filter centre frequencies track the clock frequency.
The MSGEQ7 is stated by MSI to provide optimum performance at +5.0 V and exactly that is furnished by voltage regulator IC3 flanked by the usual array of decoupling capacitors, ceramic and electrolytic.
The MSGEQ7 is marked by low quiescent current of less than 1 mA typical, making it eminent for portable audio devices. The in-chip multiplexor (sic; MSI datasheet) is controlled by a reset (RST) and a strobe pin, permitting multiplexor readout over two pins. The multiplexor readout rate also controls the decay time (10% decay per read) — hence no external pins or parts are needed for this function.
The ATMega328P-AU micro and the OLED display are so common they do not merit further discussion as far as hardware description is concerned. Jumpers JP1 and JP2 can be set to one of four values: 00, 01, 10, 11, to select one of four patterns on the OLED:
- white bar graph;
- green-yellow-red bar graph (each bar is made of 3 colours);
- thin blue bar graph;
- thin red bar graph.
A jumper installed equals 0, and no jumper, 1. Since this version of the spectrometer is designed to be used inside an audio system, the display mode selection can be done in a cheap and simple way using just two jumpers.
The schematic of the spectrometer version 180166-2 is given in Figure 2.
This circuit can be fixed inside a small portable enclosure with space for the connectors and push switch, and a clearance for the display face. It is powered at 5 VDC through USB connector K1. This board allows the four display patterns to be selected by pressing S1.
Software
The control software for both versions of the project was written in Atmel studio targeting the ATMega328p MCU ticking at an internal clock frequency of 8 MHz. The software, freely downloadable from the ElektorLabs magazine website, controls the multiplexor (sic) inside IC2 through pulses on the STROBE and RST pins. The resulting signals on pins PC1 and PC2 of the ATMega MCU enable the internal ADC to ‘read’ different frequencies on pin PC0. These frequencies are then graphically displayed on a 0.96-inch RGB OLED connected to PORTB of MCU. The MCU communicates with the OLED using the I²C protocol and reads the user selected display mode PC3 and PC4.Two versions, again
Each version of the project (i.e. 8-12 VDC wall-wart, or USB powered) has its own PCB and Components List, so be sure not to mix them up. Also, rigorously check your solder work and component choice before proceeding with …testing version 180166-1:
- install jumpers JP1 and JP2 to select the display mode;
- connect the audio signal to connector K2
- power up the circuit through connector K1 by applying 8-12 VDC
- check the audio spectrum on display.
Those of you having built the ‘USB powered’ version can start…
testing version 180166-2:
- connect the audio signal to audio jack K2;
- connect the PC's USB or a 5-V USB adapter to K1;
- check the audio spectrum on display.
To change the display pattern, press S1. The display mode changes on each switch press.
 Component Lists
PCB 180166-1
ResistorsR1,R2 = 22 kΩ, 1%, 125 mW, 150 V
R3 = 220 kΩ, 1%, 125 mW, 150 V
R4 = 10 kΩ, 1%, 125 mW, 150 V
Capacitors
C1 = 1 nF, 50 V, 10%
C2 = 33 pF, 50 V, C0G, 10%
C3-C6,C9,C10 = 0.1 µF, 100 V, ±10%
C7 = 22 µF, 20 V, TAJ Series, ±10%
C8 = 22 µF, 10 V, TAJ Series, ±10%
Inductor
L1 = 10 µH
Semiconductors
IC1 = ATmega328P-AU, programmed, Elektor Store #180166-41
IC2 = MSGEQ7
IC3 = KF50BD-TR
Miscellaneous
K1 = 2-pin pinheader, 0.1’’ pitch
K2 = 3-pin pinheader, 0.1’’ pitch
DIP Socket, 0.1’’ pitch, 2227MC Series, 0.3’’ length
LCD1 = M605 0.95-inch, 7-pin, full colour 65K, ssd1331 OLED
7-way pinheader receptacle, 0.1’’ pitch
PCB 180166-1, Elektor Store
Quick Specifications, version 180166-1
- Compact 0.96-inch full colour OLED display
- 7-audio-band spectrogram
- 8 V – 12 VDC supply
- Small and compact design with low power consumption
- 4 display patterns selectable on 2 jumpers
PCB 180166-2
ResistorsR1 R2 = 22 kΩ, 1%, 125 mW, 150 V
R3 = 220 kΩ 1%, 125 mW, 150 V
R4 = 10 kΩ, 1%, 125 mW, 150 V
Capacitors
C1 = 1 nF, 50 V, 10%
C2 = 33 pF 50 V, C0G, 10%
C3-C7 = 0.1 µF, 100 V, 10%
C8 = 10 µF, 10 V, TAJ Series, 10%
Inductor
L1 = 10 µH
Semiconductors
IC1 = ATmega328P-AU, programmed, Elektor Store #180166-42
IC2 = MSGEQ7
Miscellaneous
K1 = Micro USB Type B receptacle, vertical mounting
K2 = Jack socket, 3 contacts, 3.5 mm, PCB mount
DIP Socket, 0.1’’ pitch, 2227MC Series, 0.3’’ length
LCD1 = M605 0.95-inch 7-pin full colour 65K, ssd1331 OLED
7-way pinheader receptacle, 0.1’’ pitch
S1 = tactile switch, non-Illuminated, 24 V, 50 mA
PCB 180166-2, Elektor Store
Quick Specifications, version 180166-2
- Compact 0.96-inch full colour OLED display
- 7-audio-band spectrogram
- USB 5 VDC supply
- Small and compact design with low power consumption
(180166)
➔ Do you want to read more ElektorLabs articles? Become an Elektor member now!
Read full article
Hide full article
Discussion (1 comment)