The Serial Plotter built into the Arduino IDE creates graphs from numerical data. Unfortunately, there is no user manual for it.
One of the strong points of Arduino is its easy-to-use serial port which makes it simple to export data, to send commands to it, or to help with debugging.
Most Arduino users will know about the Serial Monitor built into the IDE (available from the ‘Tools’ menu, or with keyboard shortcut Ctrl+Shft+M). This is a simple serial terminal that displays any data received on the serial port. It also lets you send strings – e.g. commands or data – from the computer to the Arduino board.
The Serial Monitor can be handy for debugging by letting the sketch send text messages about what it is doing or what it is supposed to be doing.
The Serial Plotter
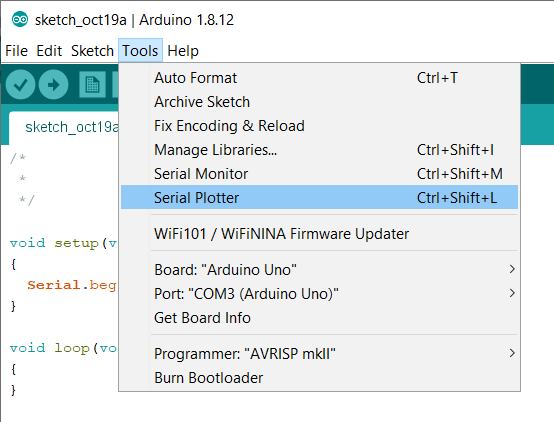
The Serial Monitor can display numerical values too, of course. However, trying to follow the evolution of a parameter when it is printed as a list of values is not always easy, which is why the Arduino IDE also has a Serial Plotter (on the ‘Tools’ menu, or with keyboard shortcut Ctrl+Shft+L).
The Serial Monitor and the Serial Plotter are both accessible from the IDE's Tools menu.
The Serial Plotter creates graphs of the numerical data that it receives and displays them. It is not super powerful and does not have many options, but it is easy to use. Unfortunately, there is no documentation for it. You must refer to the Java source code to find out what it is capable of. Doing so, you will discover the following features:
Unlimited number of graphs;
Automatic scaling of the vertical or Y-axis;
Five hundred points on the horizontal or X-axis;
Show the most recent 500 data points.
500 data points, not more. When the horizontal axis value hits 500, it will start scrolling.
Plotting a Graph
After opening the Serial Plotter, select the same baud rate as the speed specified in Serial.begin in the sketch. The box next to the speed selection box is intended for sending data back to the sketch, exactly as in the Serial Monitor. This allows you to control the sketch in some way.
You don’t need to learn special commands to use the Serial Plotter, it makes use of the same serial port commands as the Serial Monitor. The Serial Plotter is just another way to visualize data sent over the serial port. The only important thing is the way you format the data.
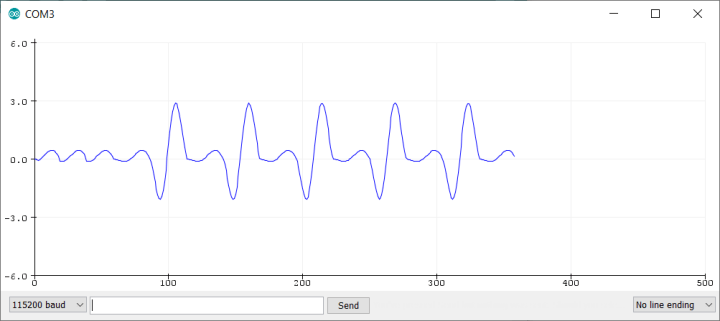
To plot a graph of a single parameter, a sensor value for instance, it is enough to separate the values by a newline character. In other words, to send the values use
Serial.println(sensor_value); // Use println when plotting only one graph.
The Scales Are Out of Control
The Serial Plotter uses these values for the vertical axis, the Y-axis; it increments the horizontal or X-axis itself. In other words, the first value sent will be considered the ‘y’ value for x = 0, the second value is the ‘y’ value for x = 1, and so on, and so forth. When x reaches 500, the graph starts scrolling horizontally; new points are added at the end, the old points fall off from the beginning.
When the y-value is out of bounds, the vertical axis scales up automatically to keep everything within vertical bounds. The same is true the other way around, i.e. when suddenly all values fit in a smaller bound (because a high value fell off at the beginning when the graph is scrolling), the scale goes down.
Multi-graph Plotting
To draw graphs for two parameters or more, just send the values for the different graphs as a list of values separated by either a comma (‘,’), a whitespace (‘ ’) or a tab character (‘\t’) and terminate the list with a newline character, for instance:
When using the comma as a separator, the format is known as ‘CSV’, which stands for comma-separated values. Most spreadsheets can import such files (the better spreadsheet even lets you specify the separator character), so when things are looking good in the Serial Plotter, you can use the Serial Monitor to export many of these lines and copy paste them into a spreadsheet to make pretty graphs and do other post processing.
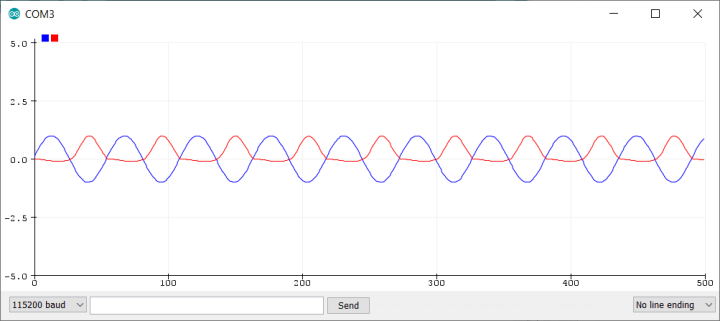
The list of data values is interpreted as y-values for the same x-value, so all the graphs update at the same time and speed.
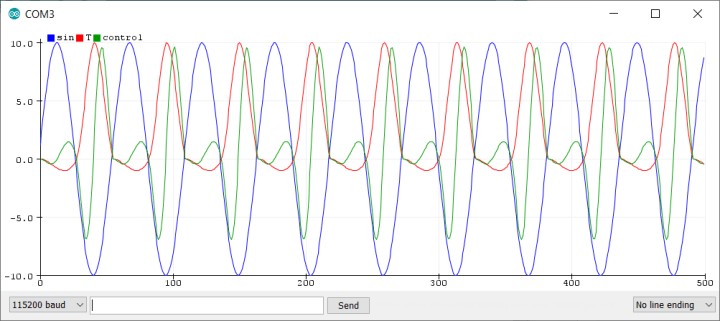
The plotter will choose a different colour for each graph, the user has no control over this. The only way to influence this a little is by changing the order of the data. Three graphs with labels.
Labels
The Serial Plotter does have one “fancy” option: it lets you specify a label for each graph. Labels are only available when there are two graphs or more. There are two ways to do this:
Before sending any data values, first send a list of labels with the labels separated by either a comma, a whitespace, or a tab character and end with a newline character. Therefore, the labels themselves cannot contain these characters. The data must be sent in the same order as the labels to match things up. Example
temperature,humidity,pressure[CRLF]
Send labels and values as pairs and separate the two with a colon (‘:’), i.e.
temperature:21,humidity:76,pressure:1007[CRLF]
Make sure to always send these pairs in the same order to prevent the plotter from mixing up the data for different graphs. A list of label-value pairs must again be separated by either a comma, a whitespace, or a tab character and end with a newline character.
Note that as soon as you send a text string, it will be considered a label. It is therefore quite easy to mess up the labels. Another way to mess-up the labels is to forget delimiters, making data end up in a label.
Quirks & Limitations
The X-axis goes on forever, there is no way to restart the graph programmatically. The only way to do this is to close the Serial Plotter and then open it again. Sometimes it is even necessary to do this twice to get rid of stale labels and/or data.
It is not possible to plot a point at a (x,y) position of your choice; new points are always added at the end.
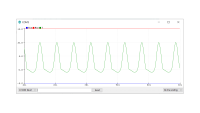
The Y-axis scales automatically, which seems nice, but can be very annoying, especially when there are outliers or glitches that force the scale up and make it hard or even impossible to see the much smaller data of interest. This can also happen when one data series is in the range of, say, [−1,+1], and another in the range [−100,+100]. In that case the scale will be from −100 to +100.
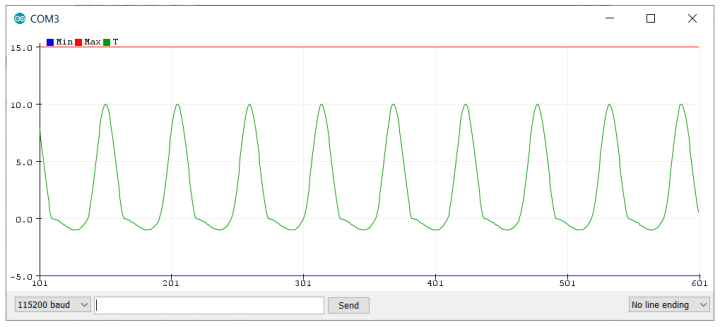
Some people try to outsmart the plotter by adding something like “min: −100,max:100” to the list of data values in an attempt to stop autoscaling, but this only works when every value stays within these bounds. Avoiding automatic scaling of the vertical axis by plotting Min and Max lines works if values are *always* in range.The minimum scale usually is from −6 to +6, but −5 to +5 has been observed by me.
Helper Function
Below is a small helper function that you can insert in a sketch to make the Serial Plotter slightly more user-friendly while keeping the sketch readable at the same time:
void plot(String label, float value, bool last)
{
Serial.print(label); // May be an empty string.
if (label!="") Serial.print(":");
Serial.print(value);
if (last==false) Serial.print(",");
else Serial.println();
}
If the string ‘label’ is specified, this function will print a “label:value” pair. If label is an empty string, then it will only print the value. This allows it to output pure CSV-formatted data in the Serial Monitor, good for use with spreadsheets. Note that you cannot have both the Serial Monitor and the Serial Plotter open at the same time.
After opening the serial port, call it like so:
plot("Temperature",temperature_value,false); // Graph1, more graphs follow.
plot("Humidity",humidity_value,false); // Graph2, more graphs follow.
plot("Pressure",pressure_value,true); // Graph3, last graph.
Remember to restart the Serial Plotter (close and reopen it) every time you modify the sketch to ensure that all stale data and labels are removed. When in doubt, repeat this procedure.
Want to build a project?
Bring your design to life with the Elektor PCB Service, powered by Eurocircuits. Upload the project files and order professionally manufactured PCBs or assembled boards through a proven European production platform.
Supporting KiCad, Eagle, Gerber, and ODB++ formats, the service is suitable for everything from prototypes and validation builds to series production and volume manufacturing.
Elektor Magazine has been one of the leading sources of information on electronics for engineers, designers, start-ups and companies for 65 years. Our magazine is powered by an active community of electronics engineers – from students to professionals – who are passionate about designing and sharing innovative ideas.
For them, we publish hundreds of items a year, in formats such as articles, videos, webinars, and other learning formats. Our mission is to share knowledge in every possible way and inspire readers with the latest developments within the electrical engineering sector.
Thank you for your vote!
Leave further comments in the fields below.
Thank you for your vote!
If you wish to leave a comment with your rating, please first use the login below. If not, just close this window.

Discussion (0 comments)