
BP and Shell: challenged, but 'doing OK'
on
BP and Shell: challenged, but ‘doing OK’
Aware that they are not making the best of their assets and people, the two Europe-based energy super-majors – BP and Shell – are pursuing aggressive strategies to match, perhaps even exceed, the financial performance of the sector leader, ExxonMobil. While EER looks at how they plan to close the gap, BP’s chief Tony Hayward sums up the situation: ‘It remains challenging – but we’re doing OK.’
 |
While BP and Shell differ in many ways, in some fundamental ways they are presently in very similar positions. Both companies are under relatively new leaderships. At BP, Tony Hayward replaced Lord John Browne as chief executive in 2007, while at Shell, Peter Voser took the reins from Jeroen van der Veer last July. Both companies feel that while they have excellent portfolios of assets, a wealth of human talent, and impressive technological expertise, these resources have not been reflected in the kind of industry-leading financial performance that ExxonMobil manages to achieve. And both companies are currently entering a second phase of strategy development aimed at closing this gap.
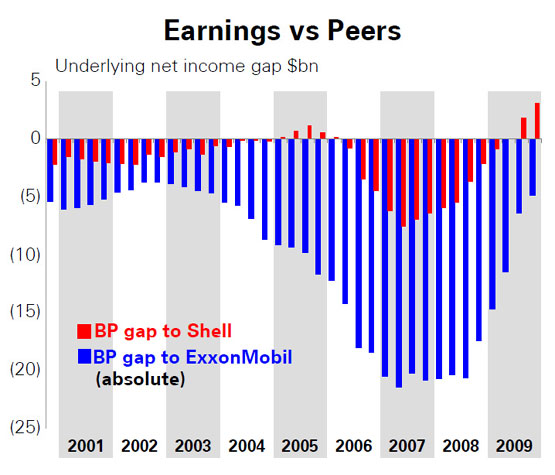
The gap must be particularly frustrating for BP, which in 2009 produced a touch more oil and gas than ExxonMobil – a total of 3.998 million barrels of oil equivalent per day (mboe/d) compared with Exxon’s 3.932 mboe/d – but whose underlying net income amounted to $14.6 billion, almost $5 billion less than ExxonMobil’s $19.2 billion. This is despite the new strategy that Hayward embarked on when he took the helm from Browne, a strategy the company has been pursuing vigorously ever since.
At a presentation to analysts in the New York Stock Exchange last month, Rex Tillerson, CEO of ExxonMobil, could not resist having a dig at his peers. Commenting on how his company had weathered the global recession, he said: ‘The economic downturn has caused some competitors to re-evaluate their near-term business plans. This includes massive write-downs of assets and loss of shareholder equity, publicly disclosed corporate re-organisations, delay or cancellation of projects, and, for some, new strategies.’
| Comparing the majors |
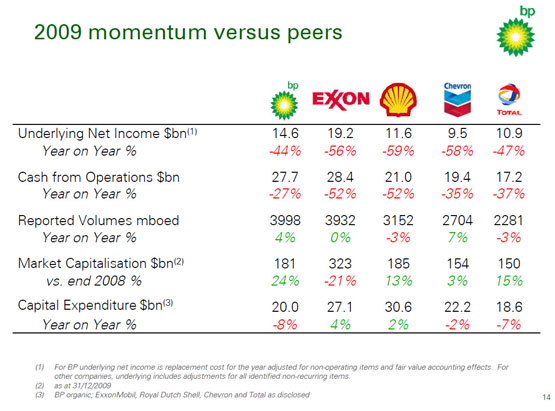 |
 |
| Source BP |
Work harder
At BP’s strategy presentation last month, Hayward said: ‘The key message is that whilst our portfolio is among the best in the industry, our financial performance still has some catching up to do. We’ve made a lot of progress over the last three years but there’s more to be done. There is a real opportunity to make this portfolio work harder for our shareholders. Our strategy remains unchanged – but we are now embarking on a new phase to realise the potential of the portfolio built over the past decade. We have considerable scope to pursue sector leadership, particularly in costs, capital efficiency and margin quality.’
The message from Shell’s strategy meeting was remarkably similar. ‘We have a talented workforce at Shell,’ said Peter Voser, ‘but when I became CEO in the middle of last year, I did think that the organisation of the company was working against us. Shell had become too complicated, and slower than I’d like, and working on too many areas and options. So we started to change with the re-organisation last year, which I called Transition 2009.’
Like Hayward, Voser believes his company has a strong upstream portfolio that should drive more profitable growth and a more competitive financial performance. And like BP, Shell is now embarking on a second phase of change. ‘We have come a long way,’ said Voser, ‘but there is still much more to do at Shell. This is all about cash flow from operations, investment in new projects, and cash returns to shareholders. I want to see sharper delivery of our strategy and an even more commercial focus in everything that we do.’
Voser’s objectives are indeed ambitious. Last year’s Transition 2009 programme led to a reduction in the number of people the group employs of 5,000 and underlying cost savings of $2 billion. Another 2,000 staff will leave between now and the end of 2011 and Voser wants to see cost savings of another $1 billion in 2010.
BP too has been shedding staff: over the past two years 22,000 have left while 14,000 have joined, a net reduction of 8,000 and a churn rate that highlights how much BP has changed. Moreover, last year BP reduced its cash costs by $4 billion, 60% of which was due to the company’s strategy and the rest down to currency movements and lower fuel costs. Further cuts are expected in 2010.
Both companies – keenly aware that technological expertise is a key bargaining chip in their negotiations with governments of resource-rich countries and their national oil and gas companies – stress that the staff reductions will come mainly in support functions such as finance, human resources and IT.
Interestingly, the only mention of staff numbers at ExxonMobil’s analyst meeting was in the context of a question to Tillerson about the recent acquisition of XTO Energy. Even then, Tillerson spoke of leaving the newly acquired company’s organisation largely intact.
Production ramp-up
The accompanying chart, taken from BP’s strategy presentation, shows how the five largest international energy majors compared in 2009 on five key indicators: net income, cash from operations, production volumes, market capitalisation, and capital expenditure. It also shows year-on-year changes. A clear message is that 2009 was a challenging year for all five companies, with net income down by between two-fifths and three-fifths in all cases.
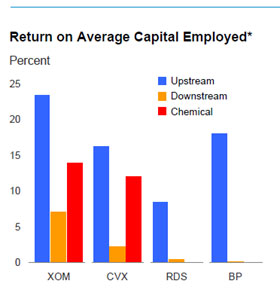
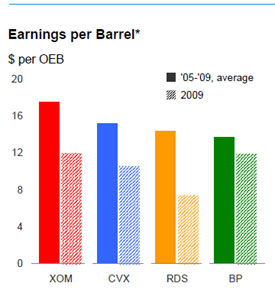
Comparing ExxonMobil and BP, while their production and cash generation were similar, BP’s net income was way below ExxonMobil’s, suggesting that its cost structure remains a burden. Shell’s oil and gas production, meanwhile, was a little over three-quarters of that achieved by BP and ExxonMobil – a difference reflected in the company’s net income and cash generation. However, its ratio of net income per barrel of production was very similar to BP’s, suggesting that Voser is right to be focusing on costs. It is worth noting in this context that as of the end of last year Shell’s market capitalisation of $185 million was larger than BP’s $181 million, but that both were dwarfed by ExxonMobil’s $323 million.
| Comparing the majors (II) |
 |
|
* Reserves based on SEC pricing bases, includes oil sands and equity companies; excludes asset sales. |
  |
| * Competitor data estimated on a consistent basis with ExxonMobil, and based on public information. |
| Source: ExxonMobil. XOM = ExxonMobil, RDS = Royal Dutch Shell, CVX = Chevron Texaco |
Along with staff and cost reductions, Voser and Hayward want to see their companies achieve strong growth, both in upstream oil and gas production and in cash flow. Voser reckons that a production ramp-up in 2011 will see volumes average 3.5 mboe/d by 2012, with growth underpinned by major new project start-ups in Qatar, North America and Asia-Pacific. Over the long term, to 2020, the company is aiming for annual production growth of 2-3%. This is significantly more ambitious than BP’s 1-2% (which assumes a $60/barrel oil price) but then Shell has a large gap to close if it wants to be up with the leaders. If Shell averages annual growth of 2.5%/year over the coming decade, by 2020 its production will rise to 4.1 mboe/d. If BP hits a target of 1.5%/year, its production volumes will rise to 4.7 mboe/d, still well ahead of Shell.
As for cash flow, Shell sees it rising 50% by 2012, in a $60/barrel oil-price world, or by at least 80% if the oil price averages $80/barrel – assuming, as CFO Simon Henry put it, ‘a more normalised world for downstream and natural gas’. Shell’s relatively poor net-income performance last year was partly due to its higher exposure to refining and natural gas. Refining margins are at very low levels and likely to remain so for some time, while natural gas prices in traded markets, such as the US and the UK, are currently being depressed by a global supply glut.
Robust outlook
Something all three super-majors agree on is that while the short-term business environment may be challenging – especially in terms of overall energy demand, refining margins and gas prices – the outlook for oil and gas demand in the medium to long term remains robust. Despite the economic downturn, global energy consumption is expected to continue rising, driven mainly by industrialisation in the developing economies. ‘We anticipate that the world will consume around 45% more energy by 2030 than it does today,’ said Hayward, ‘and that fossil fuels will remain the dominant source.’
An additional challenge is that the industry needs to bring on stream enough new production to make up for natural field decline rates. ‘By 2020,’ said Voser, ‘ the world will need 40 million barrels/day (b/d) of new oil production on stream, from fields that haven’t been developed yet. To give you some perspective, 40 million b/d is equivalent to about four times Saudi Arabia, or ten UK and Norway North Seas. These are not new observations. But it is a huge challenge for the industry, and an opportunity for Shell.’
One cannot help but wonder where production growth on that scale will come from, given that together the three super-majors will contribute only a small proportion, even if their strategies over the coming decade are viewed optimistically. Little wonder that recent months have led to growing concern that those who have been warning about the approach of ‘peak oil’ may well have a point.
Not surprisingly, all three of the super-majors emphasise the need to spend vast sums of money and effort on exploring for and appraising new resources, and ensuring they have a well-stocked pipeline of new projects reaching final investment decision (FID), under development, and coming on stream.
Carry on spending
Despite the steep drop in ExxonMobil’s net income last year – at $19.3 billion it was down 57% from 2008’s $45.2 billion – the company’s chief executive Rex Tillerson insists that capital spending plans are largely unaffected by the current global recession. ‘We are anticipating an investment profile of approximately $28 billion in 2010 and a range of $25-30 billion through the year 2014.’
Shell’s plans are similar. According to Simon Henry, the company intends to spend ‘$25-30 billion each year for the next 5 years or so’. He added: ‘The precise annual spending level will be driven by the investment choices we make and the macro environment, with some linkage of oil prices and industry costs, and of course improved affordability if oil prices are high.’
BP’s expected capital expenditure is significantly lower but still substantial. In 2009 it fell to $20 billion, from $21.6 billion in 2008, and is expected to remain at that level in 2010. Over the past three years, the company has started up 28 upstream projects, seven of them last year, including the Tangguh LNG project in Indonesia. Production growth to 2015 will be driven by the large number of project start-ups and FIDs that BP is planning.
‘Over the 2010 to 2015 timeframe,’ said Andy Inglis, chief executive of BP’s exploration and production business, ‘we plan to bring on stream a total of 42 projects, which we expect to contribute around 1 mboe/d to total production by 2015. And we are currently planning to make final investment decisions for 24 new major projects in the next two years. They are concentrated in the Gulf of Mexico, the North Sea, Azerbaijan and Angola – high-margin production areas that improve the portfolio.’
Prospects for production beyond 2015 have also strengthened over the past year. ‘As a result of the significant growth in our resource base over the last two years,’ said Inglis, ‘I am increasingly confident of the potential to sustain production growth out to the end of this decade.’
Three key sources of growth for BP in the second half of the decade will be: deepwater basins, notably in the Gulf of Mexico, Angola, Egypt and Libya; natural gas, especially unconventional gas in North America, the Middle East and North Africa, and Indonesia; and management of the world’s giant oil fields, notably the Rumaila field in Iraq.
Shell’s project portfolio is similarly impressive. Worth a special mention are two projects in Qatar due to come on stream in 2011 that will significantly boost cash flow: the massive Pearl gas-to-liquids (GTL) project, which represents an investment of some $19 billion, and the Qatargas 4 project, to which Shell has contributed $2 billion. Simon Henry told EER that together these projects would contribute around 10% of Shell’s cash flow when they are at full production, bringing in $3.5-4 billion/year.
‘Our ambitious investment programme has resulted in a build-up of non-productive capital on the balance sheet,’ said Henry. ‘We currently have about 25% of our $173 billion capital employed in this capital-under-construction or capital-unemployed category. This position will change in 2010-11, as capital under construction reaches a peak and then declines as new projects come on stream.’
Over the coming two years Shell expects to start up 12 upstream projects which will add around 0.6 mboe/d of production capacity in the 2012-13 timeframe. It also expects to put at least ten new projects into front-end engineering and design (FEED, the stage before FID) and hopes to take at least 11 FIDs to sustain growth to 2014 and beyond.
ExxonMobil expects to add over 1.5 mboe/d to its production portfolio by 2015 from new project start-ups. It should be noted that the additional production capacity BP, Shell and ExxonMobil are referring to are not net additions. The new production capacities partly have to make up for the natural decline of their existing fields.
Unconventional approach
Like BP, and indeed ExxonMobil, Shell sees unconventional gas production in North America as a major new opportunity. All three companies have been building large acreage portfolios. Shell now has material positions in two of the most prospective plays: Haynesville in Texas/Louisiana and the Montney Shale in Canada, where in 2009 it increased its gas resource base by 8 trillion cubic feet (Tcf), taking its North American unconventional gas resources to 21 Tcf (or 3,700 mboe). To put this in perspective, Norway, Europe’s largest gas exporter, has proven gas reserves of 102 Tcf. ‘We could reach 0.4 mboe/d in North America tight gas by 2020,’ said Voser.
Another gas growth opportunity is LNG in Australia, where, among other projects, Shell hopes to bring the world’s first floating liquefaction (FLNG) project on stream at Prelude before the end of the decade. ‘Globally we have some 18 million tonnes/year of LNG capacity on stream today and that will grow by 40% to 26 million tonnes/year by 2015. We have the potential to grow to around 35 million tonnes/year by 2020, with Australia being the main driver of that.’ A LNG-production of 35 millions tonnes/year is equivalent to 0.86 mboe/d.
Asked by EER how the balance of oil and gas was developing in Shell’s portfolio, Voser replied that by 2012, it would be 52% gas and 48% oil, making Shell more of a gas company than an oil company. In 2009, gas accounted for 47% of Shell’s production.
BP is on its way from 40% gas to 45% gas by the end of this decade, with unconventional gas making a big contribution to that. In 2009 BP expanded its North American shale gas portfolio by securing a new resource position in the Eagle Ford Shale. It now has material positions in four North American shale plays, the others being Woodford, Fayetteville and Haynesville. The combined resource potential is more than 10 Tcf. BP has also established a coal-bed methane (CBM) position in Indonesia that could become part of the world’s first CBM-to-LNG chain.
Scattered
Moving downstream, both Shell and BP face challenges in their refining and marketing (R&M) businesses.
A priority for BP has been to re-build the Texas City refinery that was the scene of a huge fatal explosion in 2005, for which BP’s then management attracted a storm of criticism. That project was completed in 2009. But poor safety practices have not been the only aspect of the business that has needed a lot of attention. In 2008 BP set itself a target of closing the financial performance gap that had appeared between it and its competitors by 2011. The company has already managed to exceed its targets – but continues to work on further improvements.
Shell too has been busy addressing issues in its R&M businesses. ‘Shell is active in more than 100 countries in downstream marketing,’ said Voser. ‘For me, this portfolio is too scattered, and not focused enough on profitability and growth. By focusing on fewer markets and leveraging brands we can simplify the business and improve profitability.’
Shell is also planning to improve its refining position with asset sales and new investment to upgrade its best sites. Having sold 18% of its refining capacity since 2002, it now wants to sell a further 15%.
Reassuring
A matter of perennial interest when it comes to the businesses of the energy super-majors is where they stand on oil and gas resources, and especially their proved reserves, as it is these that underpin the long-term viability of their businesses. Shell is still sensitive about the reserves-reporting scandal that engulfed the company in the middle of the last decade, and led eventually to the downfall of the then CEO, Phil Watts.
On this dimension the news from both the Europe-based super-majors is reassuring. Both have being doing better than even they expected, when it comes to exploration and appraisal success over the past couple of years.
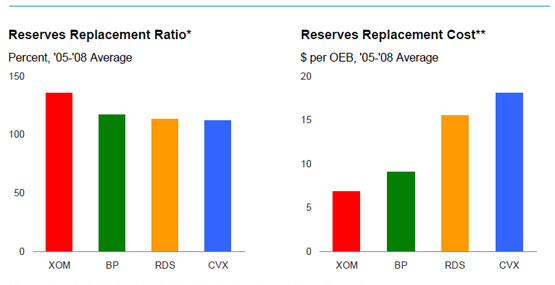
The key measure in this respect is how well the companies have done over a period of a year in replacing the proved reserves of oil and gas that they have produced: the reserves replacement ratio (RRR), calculated by dividing new proved reserves by the amount of oil and gas produced. In 2009, Shell’s RRRwas 288%. There was a small boost from changes to the US Securities and Exchange Commission (SEC) guidelines, but even excluding these effects the figure was 252%. ‘If you look at the last three years,’ said Voser, ‘we have averaged over 164% organic reserves replacement. I would call this a positive performance.’
Another key measure is a company’s reserves-to-production (R/P) ratio. Calculated by dividing proved reserves by the current annual rate of production, it indicates how many years the reserves would last at that rate. In the case of Shell, Voser said: ‘Reserves life is now 12 years, which is around average for our sector.’ For the purpose of comparison, ExxonMobil reports a reserves life of 16 years.
As for BP, Hayward said: ‘We have maintained our strong track record of reserve replacement with a 17th year of reported reserves replacement above 100%.’ More specifically, for 2009 BP reported a RRR of 129%, while ExxonMobil reported a figure of 133%. BP’s reserves life is 12.5 years.
Challenging as exploration is becoming, with ever more sophisticated technology needed to find and develop the energy the world needs, Tony Hayward, a geologist by training, once again reiterated a message which he has repeated so often that it is on its way to becoming a mantra: ‘The issues are not about the rocks and about the resources. They are about what goes on above the ground: the politics, the politics of access, and the ease with which the industry can bring on new production. It remains challenging – but we’re doing OK.’
Whether, and how quickly, the European super-majors will be able to close the financial performance gap with ExxonMobil remains to be seen. BP currently seems to be in a significantly stronger position than Shell, but both companies are determined to fix the weaknesses that had appeared in their strategies; Shell has set itself more ambitious targets for growth than BP, backed up with higher levels of planned capital expenditure. For now, however, ExxonMobil leads the field – and the US super-major will certainly not be standing still.
Discussion (0 comments)