
Review: YDLidar TG15
on
Microsoft's Kinect sensor has made the concept of distance measurement popular again or interesting for popular scientific applications. A paradoxical irony about the situation is that the Kinect does not use the LIDAR technology that has been used for years - especially in the military sector - but instead works with the deformation of infrared rays.
Probably because of the interest aroused by Microsoft's extensive marketing, the company YDLidar was founded in China in 2015 with the aim of developing LIDAR sensors "for the mass market."
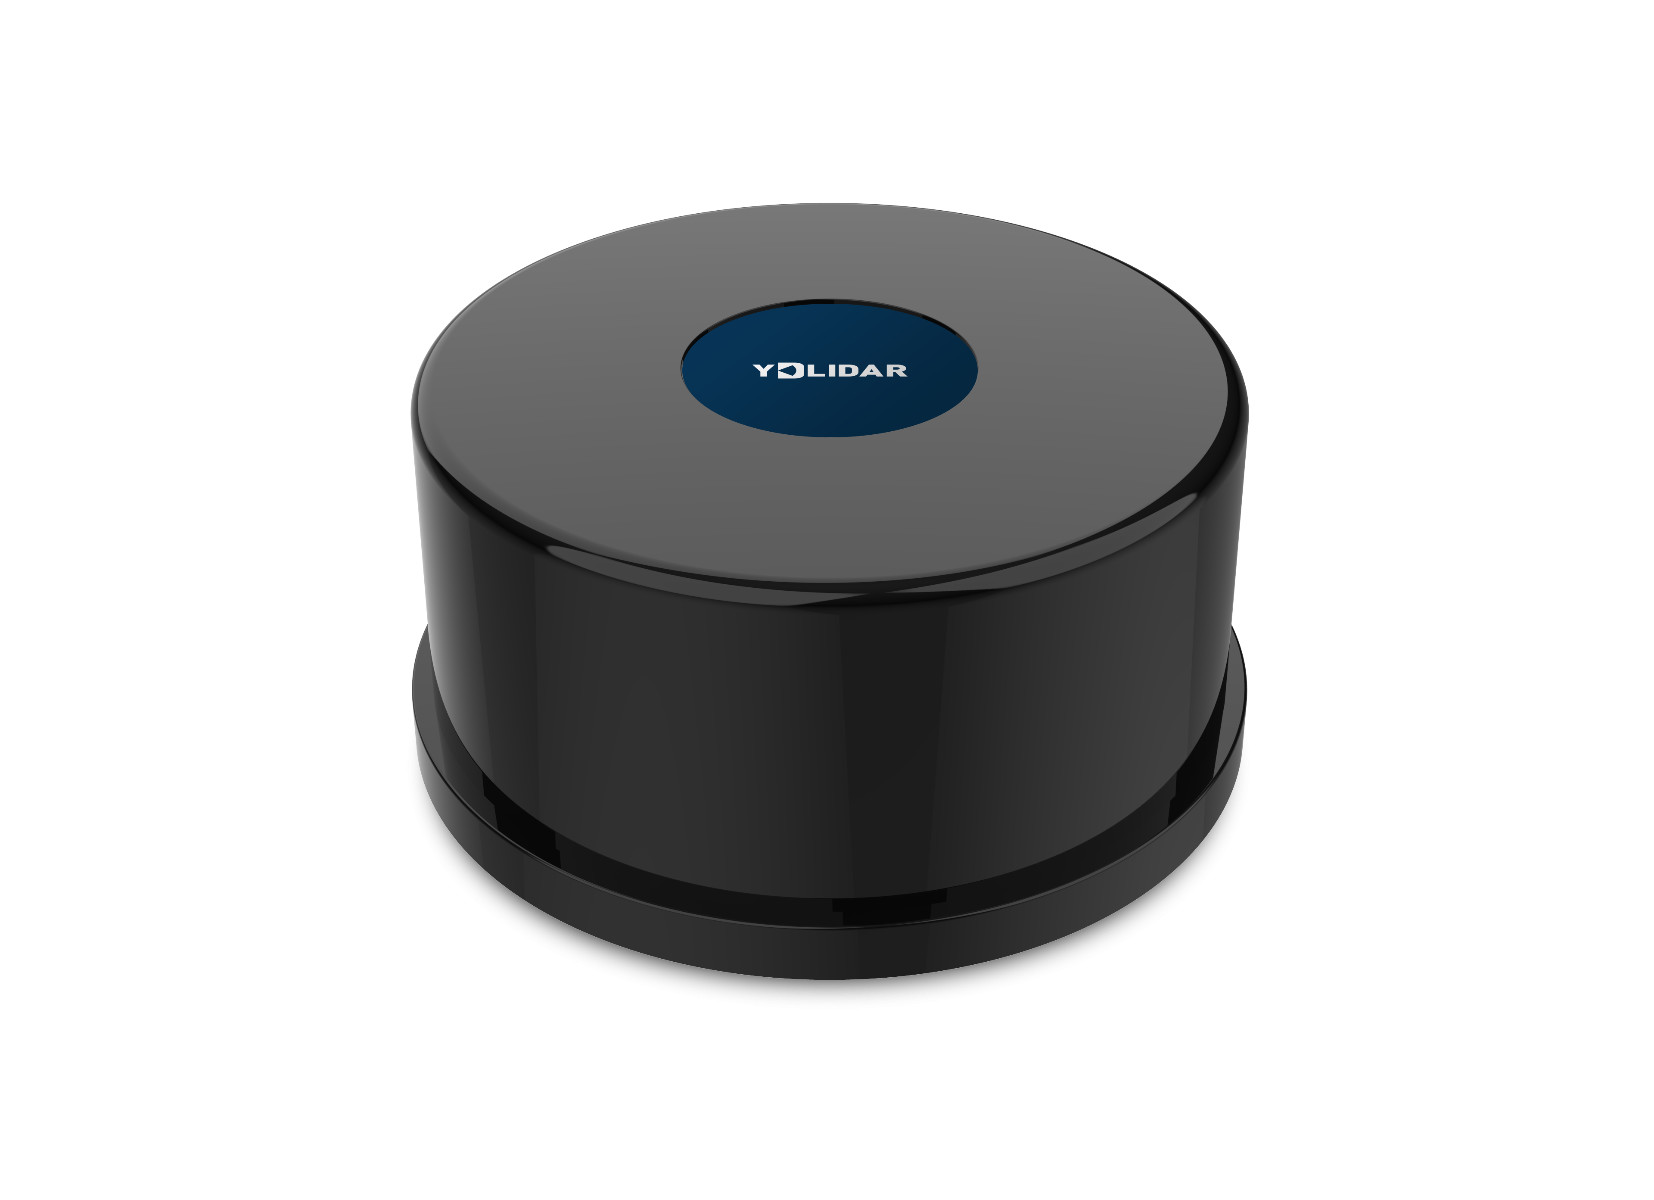
At the time of going to press, such systems with 360° coverage are available for around €330. As an example, the author will start up a TG15 LIDAR, which is available in the Elektor store (Figure 1).
YDLidar is agnostic in the area of work environments. In addition to Windows 7 and Windows 10, Ubuntu is also supported. For the sake of convenience, the author works as usual with his workstation running on Ubuntu 18.04. The first step is to check the presence of some packages that are required for compilation:
sudo apt-get install python swig
sudo apt-get install python-pip
Don't be surprised if many of these packages are already on your machine. If you work with Python and compile C programs here and there, you already have most of the products.
Deploying the SDK is done by downloading the repository from GitHub and compiling it as usual via cmake, make, and make install:
tamhan@TAMHAN18:~$ cd YDLidar-SDK/build
tamhan@TAMHAN18:~/YDLidar-SDK/build$ cmake ..
-- Build files have been written to: /home/tamhan/YDLidar-SDK/build
tamhan@TAMHAN18:~/YDLidar-SDK/build$ make
tamhan@TAMHAN18:~/YDLidar-SDK/build$ sudo make install
YDLidar also offers a procedure in the GitHub repository that enables the installation of only the Python parts of the SDK. Since the compilation time on the author's (aged) eight-core workstation was only a few seconds, it is recommended to execute the "complete" procedure.
Commissioning the hardware
If you unpack the package, you will see the contents shown in Figure 2. The actual LIDAR sensor has a five-wire cable, which supplies it with 5 V and provides a classic UART. The rectangular smaller box is a USB-to-serial converter, which allows the TG15 to be connected to a workstation, a Raspberry Pi, or a similar USB host.
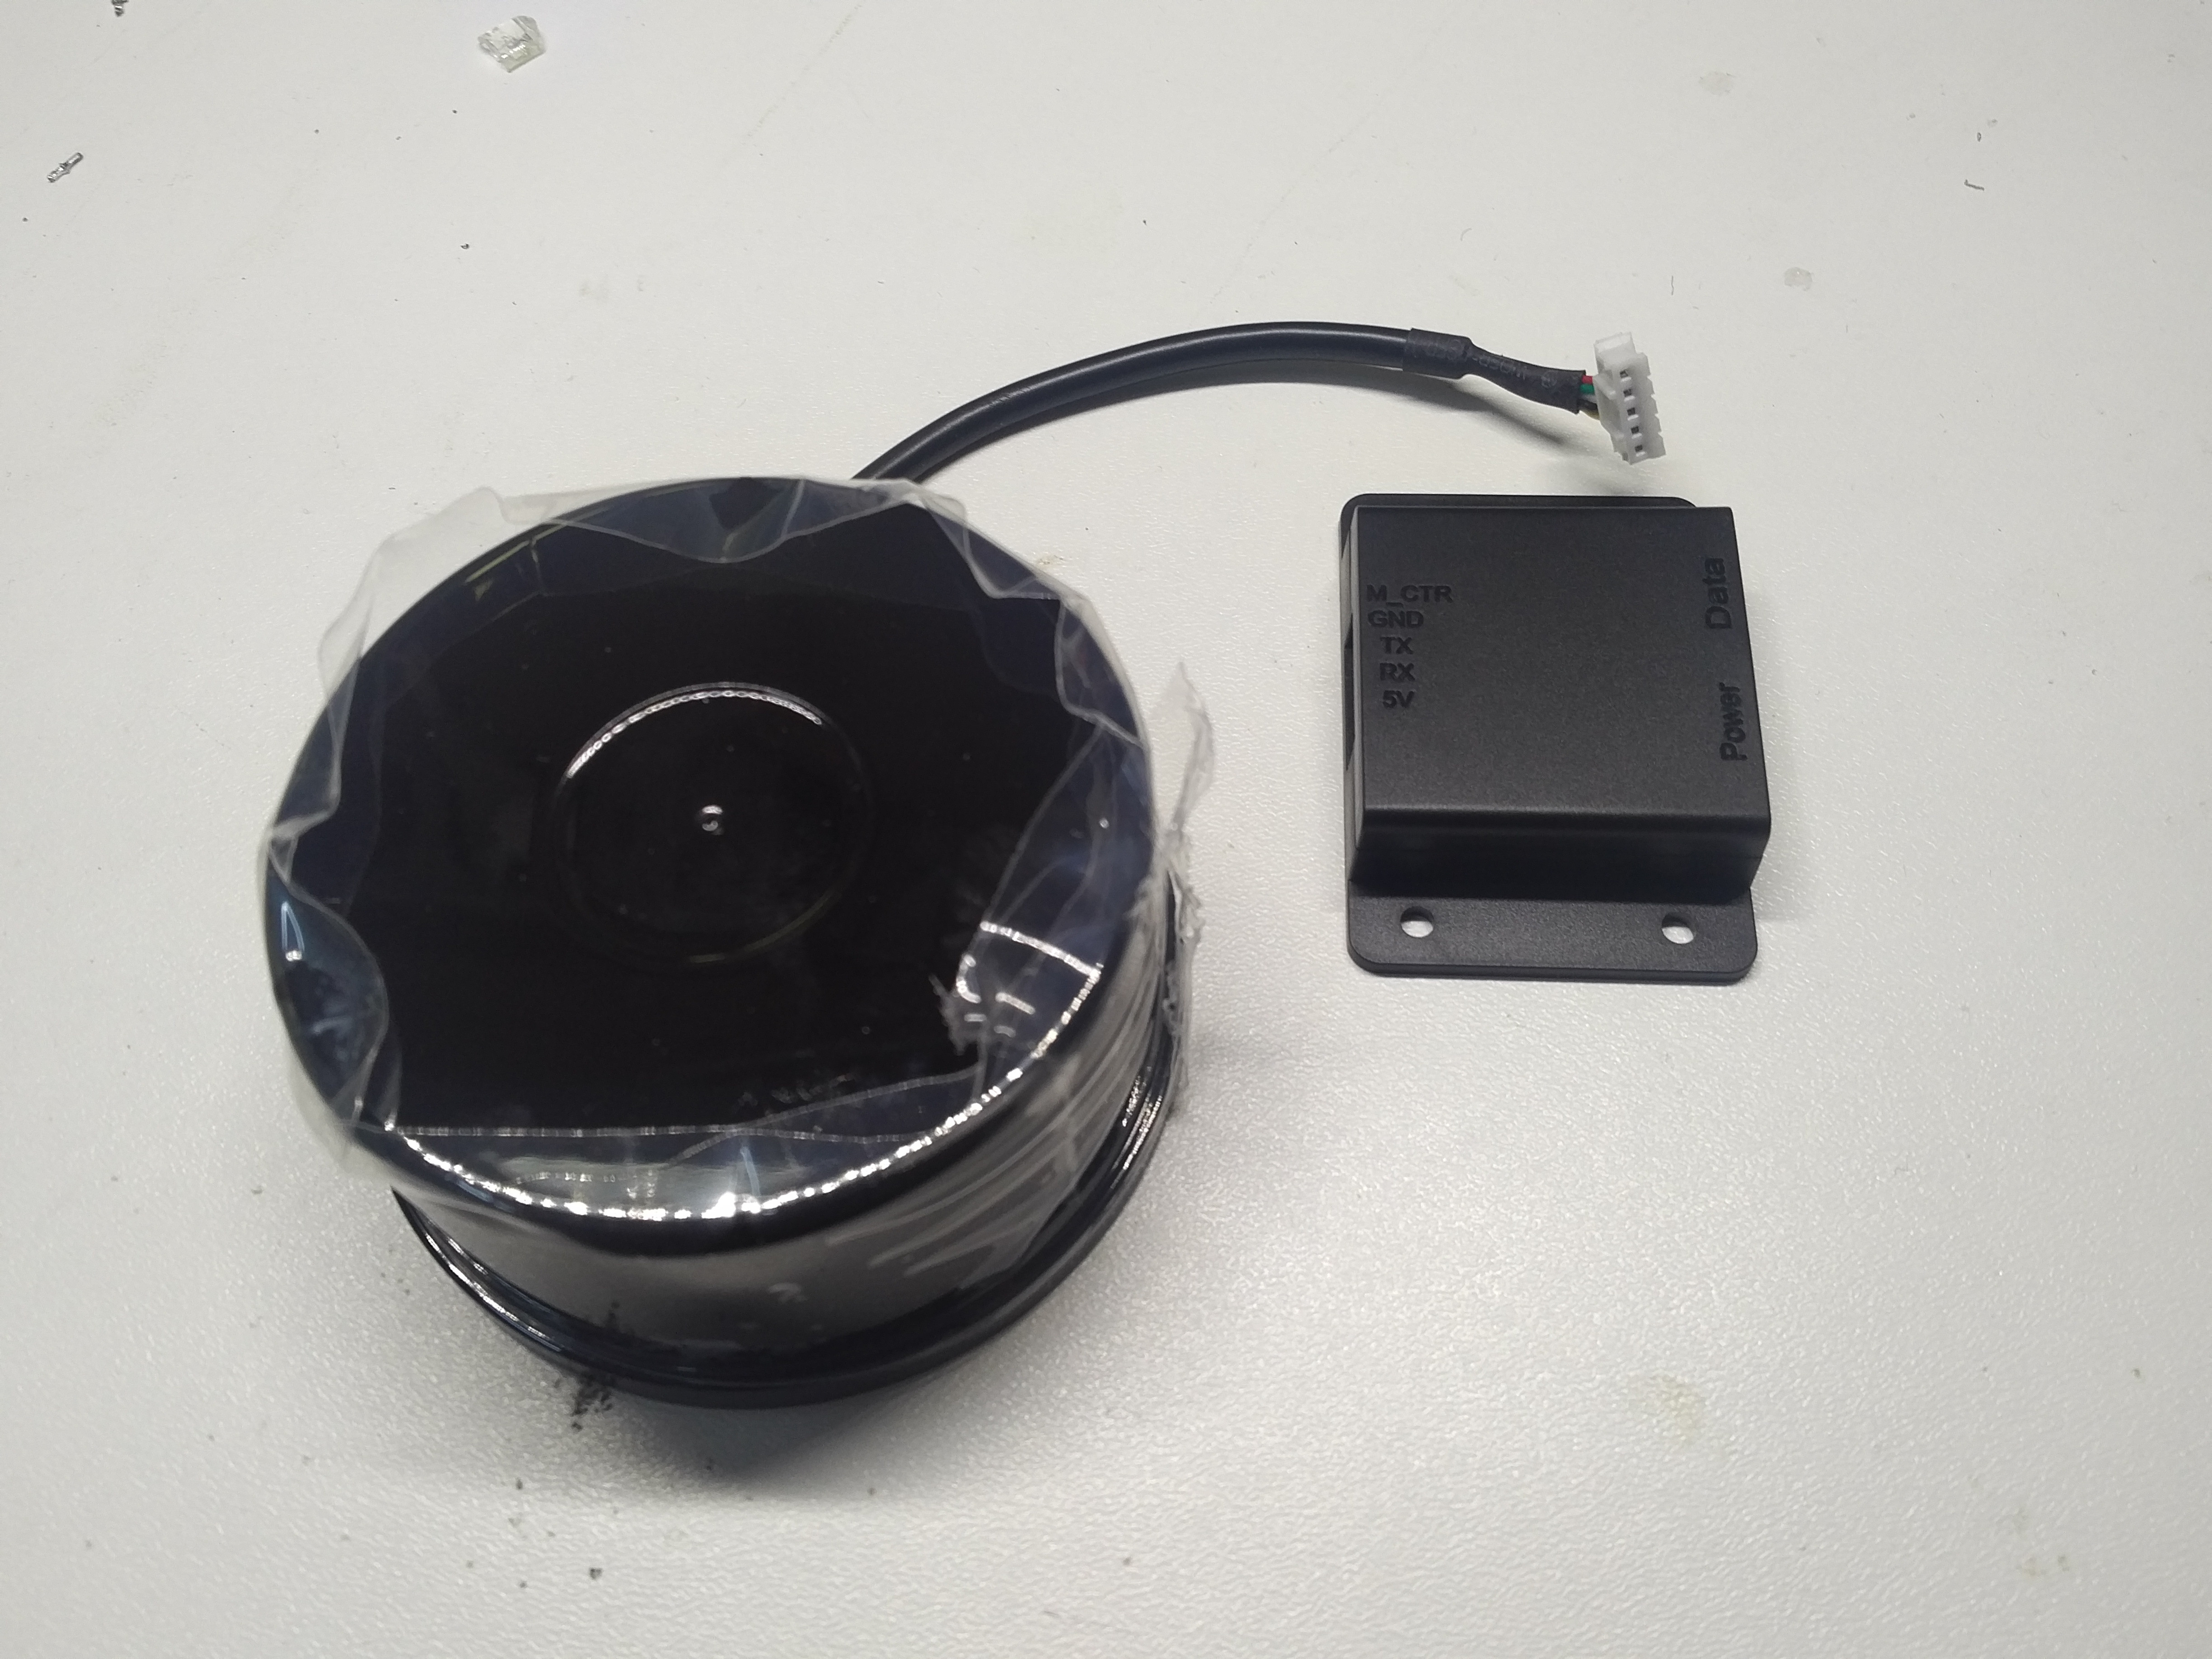
Interesting here is that the included USBC cable is responsible for data communication only. The "power supply" connects via the micro USB port. The author used a power supply with a rated output current of 1.8 A, which was included with a large Kindle.
After successfully connecting the configuration, the product appears in dmesg anyway:
. . .
[ 7043.684654] usb 6-2: cp210x converter now attached to ttyUSB0
The next step is to visit the product overview available at https://github.com/YDLIDAR/YDLidar-SDK/blob/master/doc/Dataset.md to learn more about this LIDAR system. YDLidar uses its technology in several platform sizes, which differ in the baud rate used on the UART.
In the case of our TG15, the correct baud rate is 512000. Make note of this information and then start the test application:
Please select the lidar baudrate:4
Whether the Lidar is one-way communication[yes/no]:yes
. . .
If you (like us) work with a TG15, you will reach your goal with the inputs given here. By the way, don't be surprised if the LIDAR starts to "buzz" at this point. Inside the round, puck-like element is a rotating sensor that rotates permanently while the measuring task is being performed. To protect the ball bearing, it is advisable to end the test program by pressing Ctrl + C afterwards.
Software, second
YDLidar is flexible in terms of programming. APIs for C, C++ and Python 2 are offered. If you (like the author) generally work with Python 3, you have to add some support libraries to the older version in the first step:
pip install matplotlib
At this point, it is time to attempt to start the program plot_tof_test.py. It differs from the command line client used so far in that it uses Matplotlib to create a Polar diagram:
. . .
ImportError: No module named functools_lru_cache
If the execution fails (as shown here) with an error indicating the absence of functools-lru-cache, you have to install this package using the APT-GET package manager:
In tests by the author, the use of PIP or PIP3 resulted in a reproducible program that was still not running.
After successfully satisfying the first dependency, we can command another program start, which again ends with a missing component. In the interest of convenience, we print error messages and post-installation commands en bloc here:
tamhan@TAMHAN18:~/YDLidar-SDK/python/examples$ sudo apt install python-tk
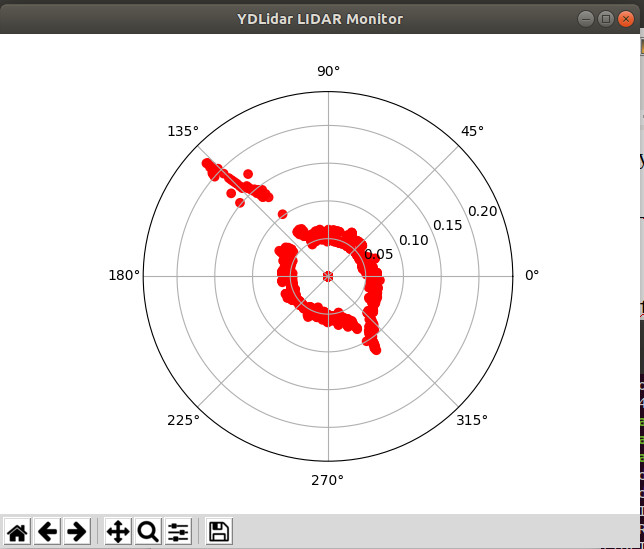
After meeting the prerequisites, we can start the program. The demo creates a plot of the environment in real time, reminiscent of a radar screen. An interesting test is to hold the radar completely in the hand, as shown in Figure 3. The matplotlib automatically calculates the outer points of the plot, which is why the displayed area "shrinks" in this case.
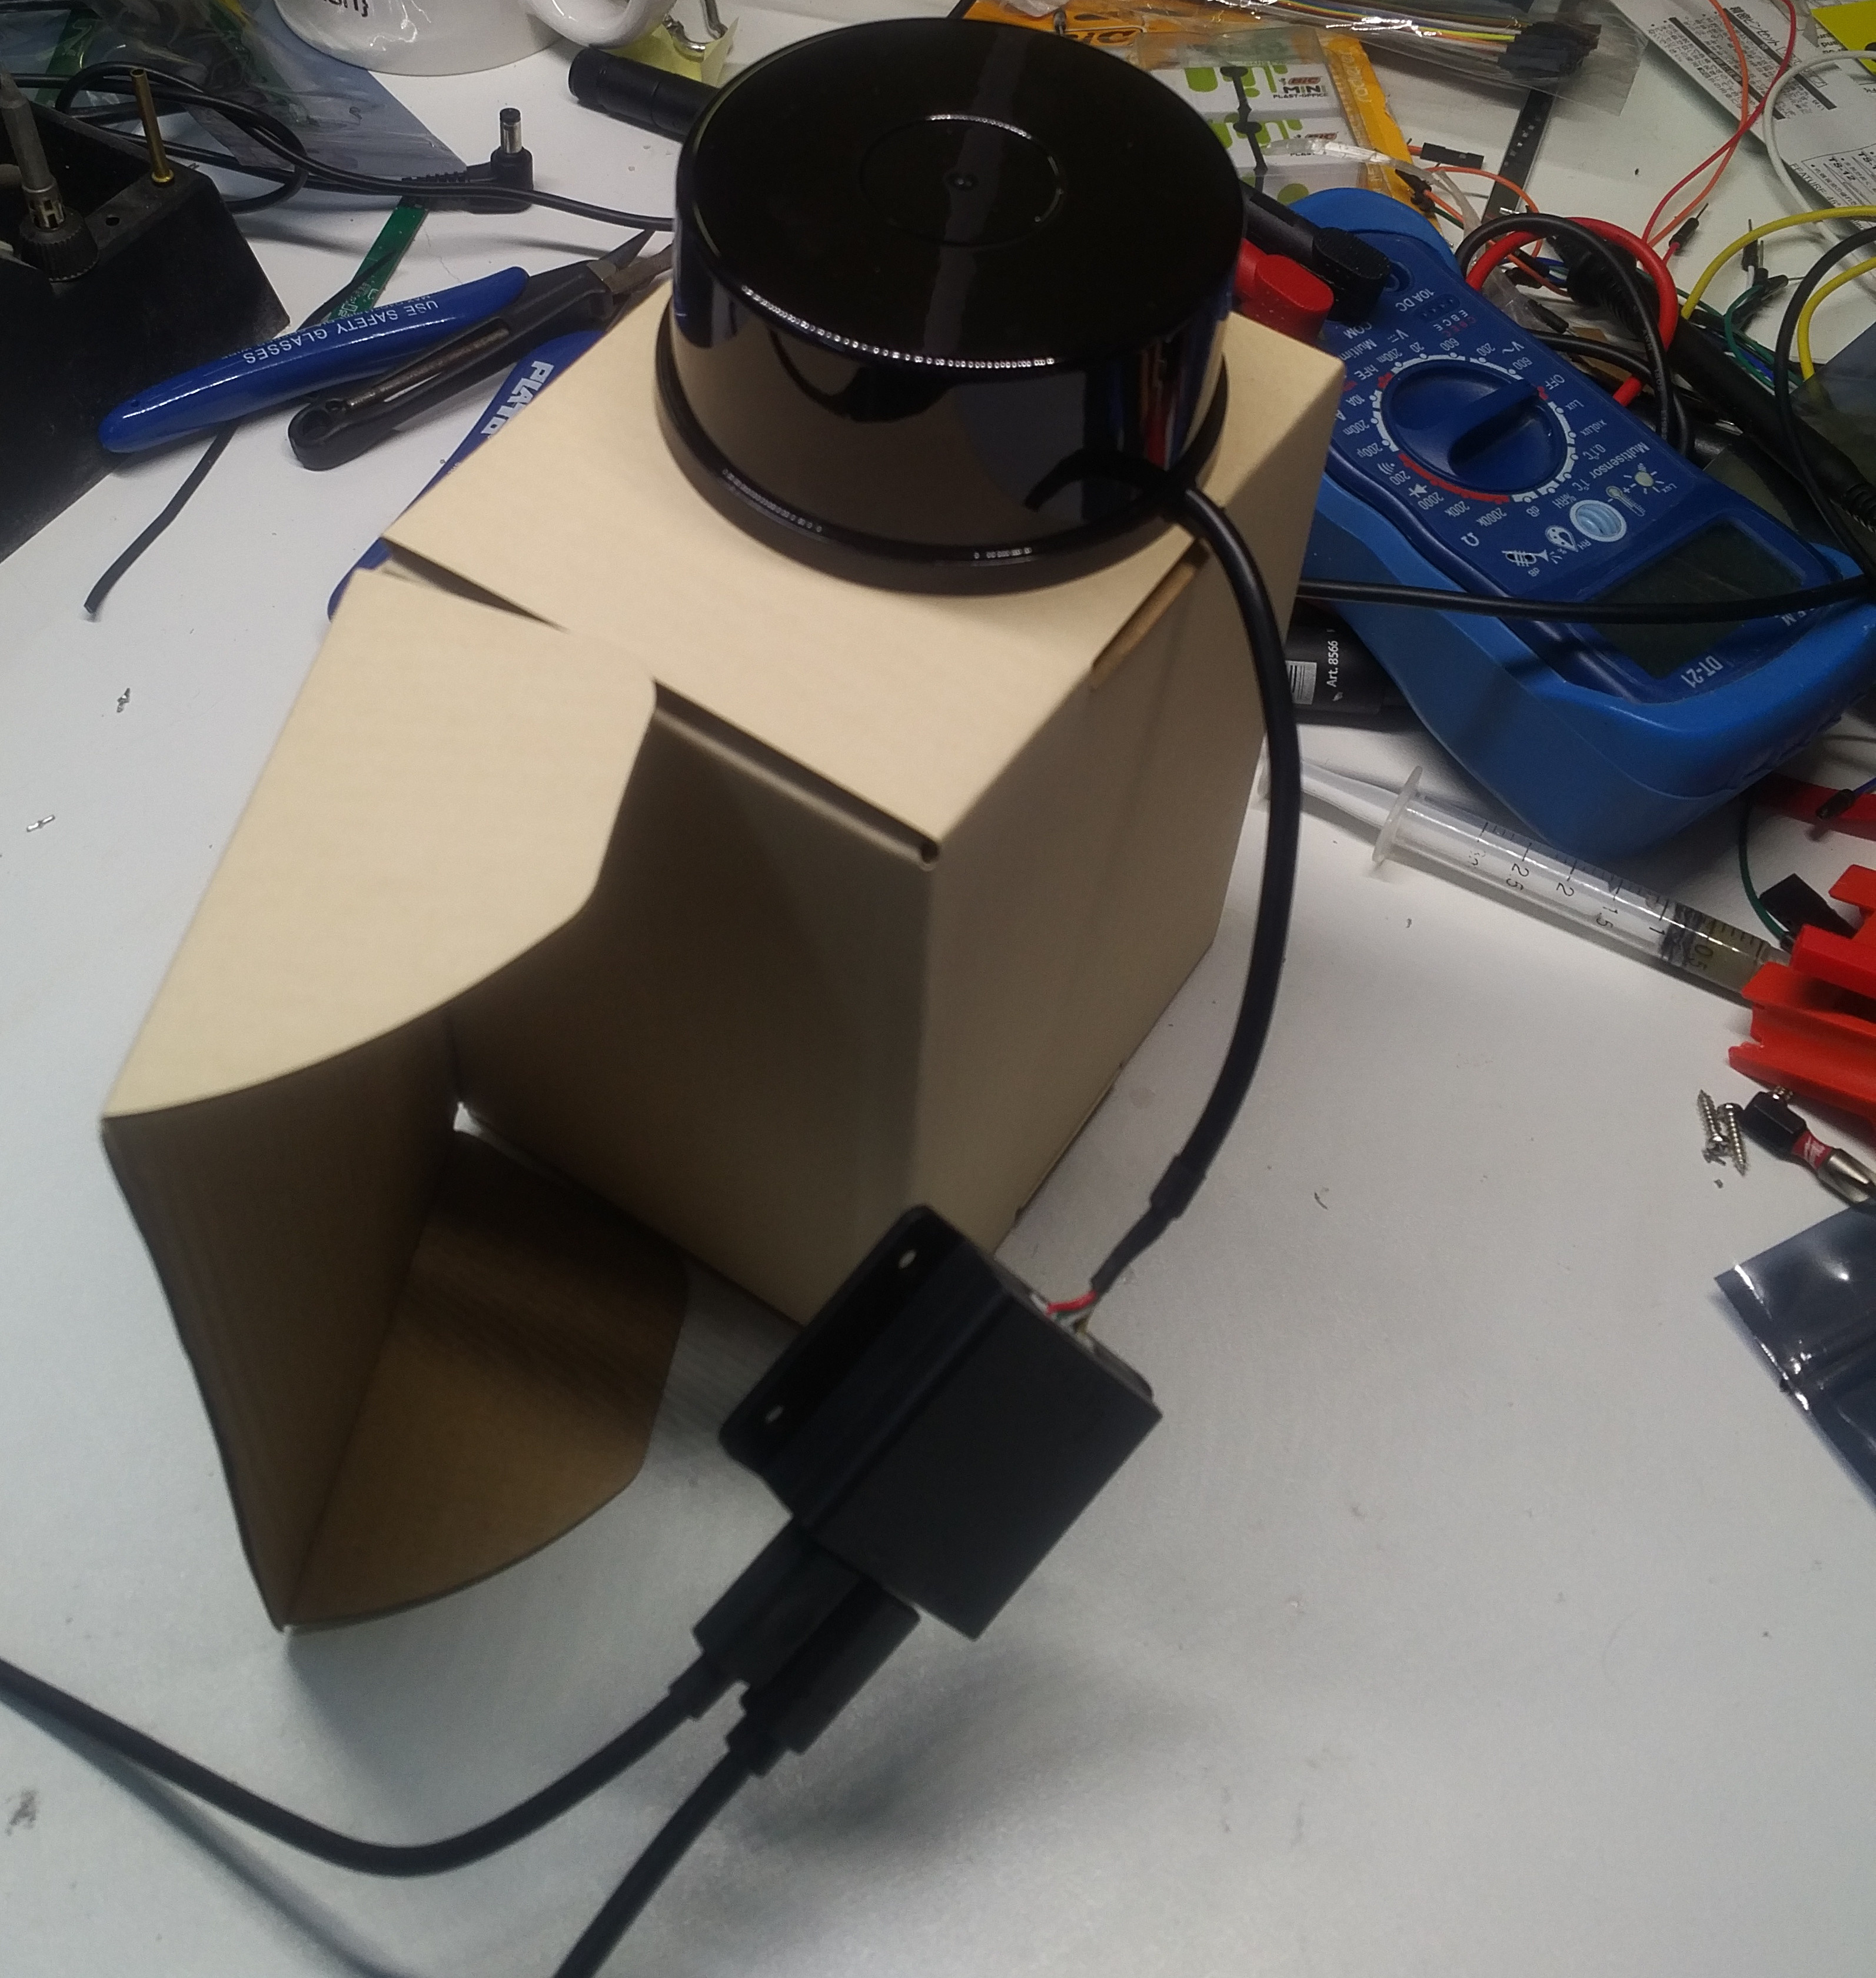
When testing in a real environment, you must remember that the "active" plane is only a few centimeters above the bottom of the device. The author placed the device on its shipping container, as shown in Figure 4.
Since LIDARs are comparatively simple animals — they "simply" provide a distance for each polar coordinate — we can most easily visualize the device's behavior by loading the file into an editor of our choice. The first thing to do is to initialize the matplotlib. It is important that the set_rmax command used to write the maximum value is set to unrealistic 32 by the development team. A first step towards "stabilization" would be to supply a smaller value here via the constant RMAX:
fig.canvas.set_window_title('YDLidar LIDAR Monitor')
lidar_polar = plt.subplot(polar=True)
lidar_polar.autoscale_view(True,True,True)
lidar_polar.set_rmax(RMAX)
lidar_polar.grid(True)
The next step is to contact the USB-to-serial converter, which makes the LIDAR data accessible to the computer:
port = "/dev/ydlidar";
for key, value in ports.items():
port = value;
The developer inteded for the library to support an entire group of different sensor systems. Therefore, some configuration actions are necessary during the startup. We have to write the scanning frequency to the laser object in addition to the port and the baud rate, for example:
laser.setlidaropt(ydlidar.LidarPropSerialPort, port);
laser.setlidaropt(ydlidar.LidarPropSerialBaudrate, 512000)
laser.setlidaropt(ydlidar.LidarPropLidarType, ydlidar.TYPE_TOF);
laser.setlidaropt(ydlidar.LidarPropDeviceType, ydlidar.YDLIDAR_TYPE_SERIAL);
laser.setlidaropt(ydlidar.LidarPropScanFrequency, 10.0);
laser.setlidaropt(ydlidar.LidarPropSampleRate, 20);
laser.setlidaropt(ydlidar.LidarPropSingleChannel, False);
scan = ydlidar.LaserScan()
The next step in this program is the animate function, which "prepares" the supplied information.
r = laser.doProcessSimple(scan);
if r:
angle = []
ran = []
intensity = []
for point in scan.points:
angle.append(point.angle);
ran.append(point.range);
intensity.append(point.intensity);
lidar_polar.clear()
lidar_polar.scatter(angle, ran, c=intensity, cmap='hsv', alpha=0.95)
Of particular importance is the for loop in the middle of the function, which iterates over the contents of the Scan.Points array. It then inserts the values into arrays which are finally passed to the LIDAR polar instance and thus ensures that the diagram is updated.
So all that is missing is the discussion of the main loop of the program which is responsible for receiving the information:
if ret:
ret = laser.turnOn();
if ret:
ani = animation.FuncAnimation(fig, animate, interval=50)
plt.show()
laser.turnOff();
laser.disconnecting();
plt.close();
The TurnOn function is important. It "activates" the actual LIDAR and returns the value False if the LIDAR is not activated. Interestingly, the sensor also monitors the power supply so it doesn't start "in case of problems."
What's next?
Anyone well versed in the defence or avionics sector can easily name 20 different applications for LIDAR systems. One application area that YDLidar is constantly pushing for is robotics. There are turnkey integrations for the widely used robot operating system ROS.
Another interesting application would be direct access to the UART data stream. In this case, the microcontroller used for evaluation could be more primitive, which saves valuable resources in drones or other weight-critical systems.
Last but not least, it should again be pointed out that the — comparatively expensive — TG15 is only one of many representatives of its group. You can also find cheaper devices in the Elektor Store that are, by and large, analogous in their programming.
Discussion (0 comments)