

GUI with Touch — for ESP32, RPi & Co.
on
Graphics user interfaces often require much more programming effort than the ‘actual code’ that does the important functions of the project. To be able to concentrate on the essential aspects of the project, ready-made solutions or the use of ready-made libraries for the graphical output of information are becoming more popular and important. Well-known names are µGFX, emWin or TouchGFX for STM32 boards, to name just a few. They all have advantages and disadvantages, such as commercial licensing or the connection to certain controller manufacturers. Of course, you could also develop a library yourself, but that's a huge amount of work and presents many pitfalls, not to mention the many bugs in the homebrew, extensive code.
Things look better with a library like LittlevGL by Gábor Kiss-Vámosi because it comes with a very project-friendly MIT license. A GUI developed with it is well suited for touchscreens, but can also be operated with a mouse, keyboard or some buttons. The code runs on popular 16-, 32- and 64-bit microcontrollers. The minimum criteria to meet are 16 MHz, 64 kB Flash and 16 kB RAM. Thus, the library fits perfectly to small boards such as the ESP32 or ESP8266 and has now been included by Espressif in their IDF. Below you’ll find support for getting started and putting together test hardware. LittlevGL also offers the opportunity to develop and test GUIs on the PC, which is not to be sniffed at. The code created on the PC for a GUI can be transferred to the target microcontroller without major adjustments.
Libraries & the ESP32
You learn most when you try something hands-on. Therefore, the use of the library within Elektor’s Weather Station is demonstrated here. The goal is a GUI suitable for touch operation. We will even realize a multi-page display for data. But this requires hardware.
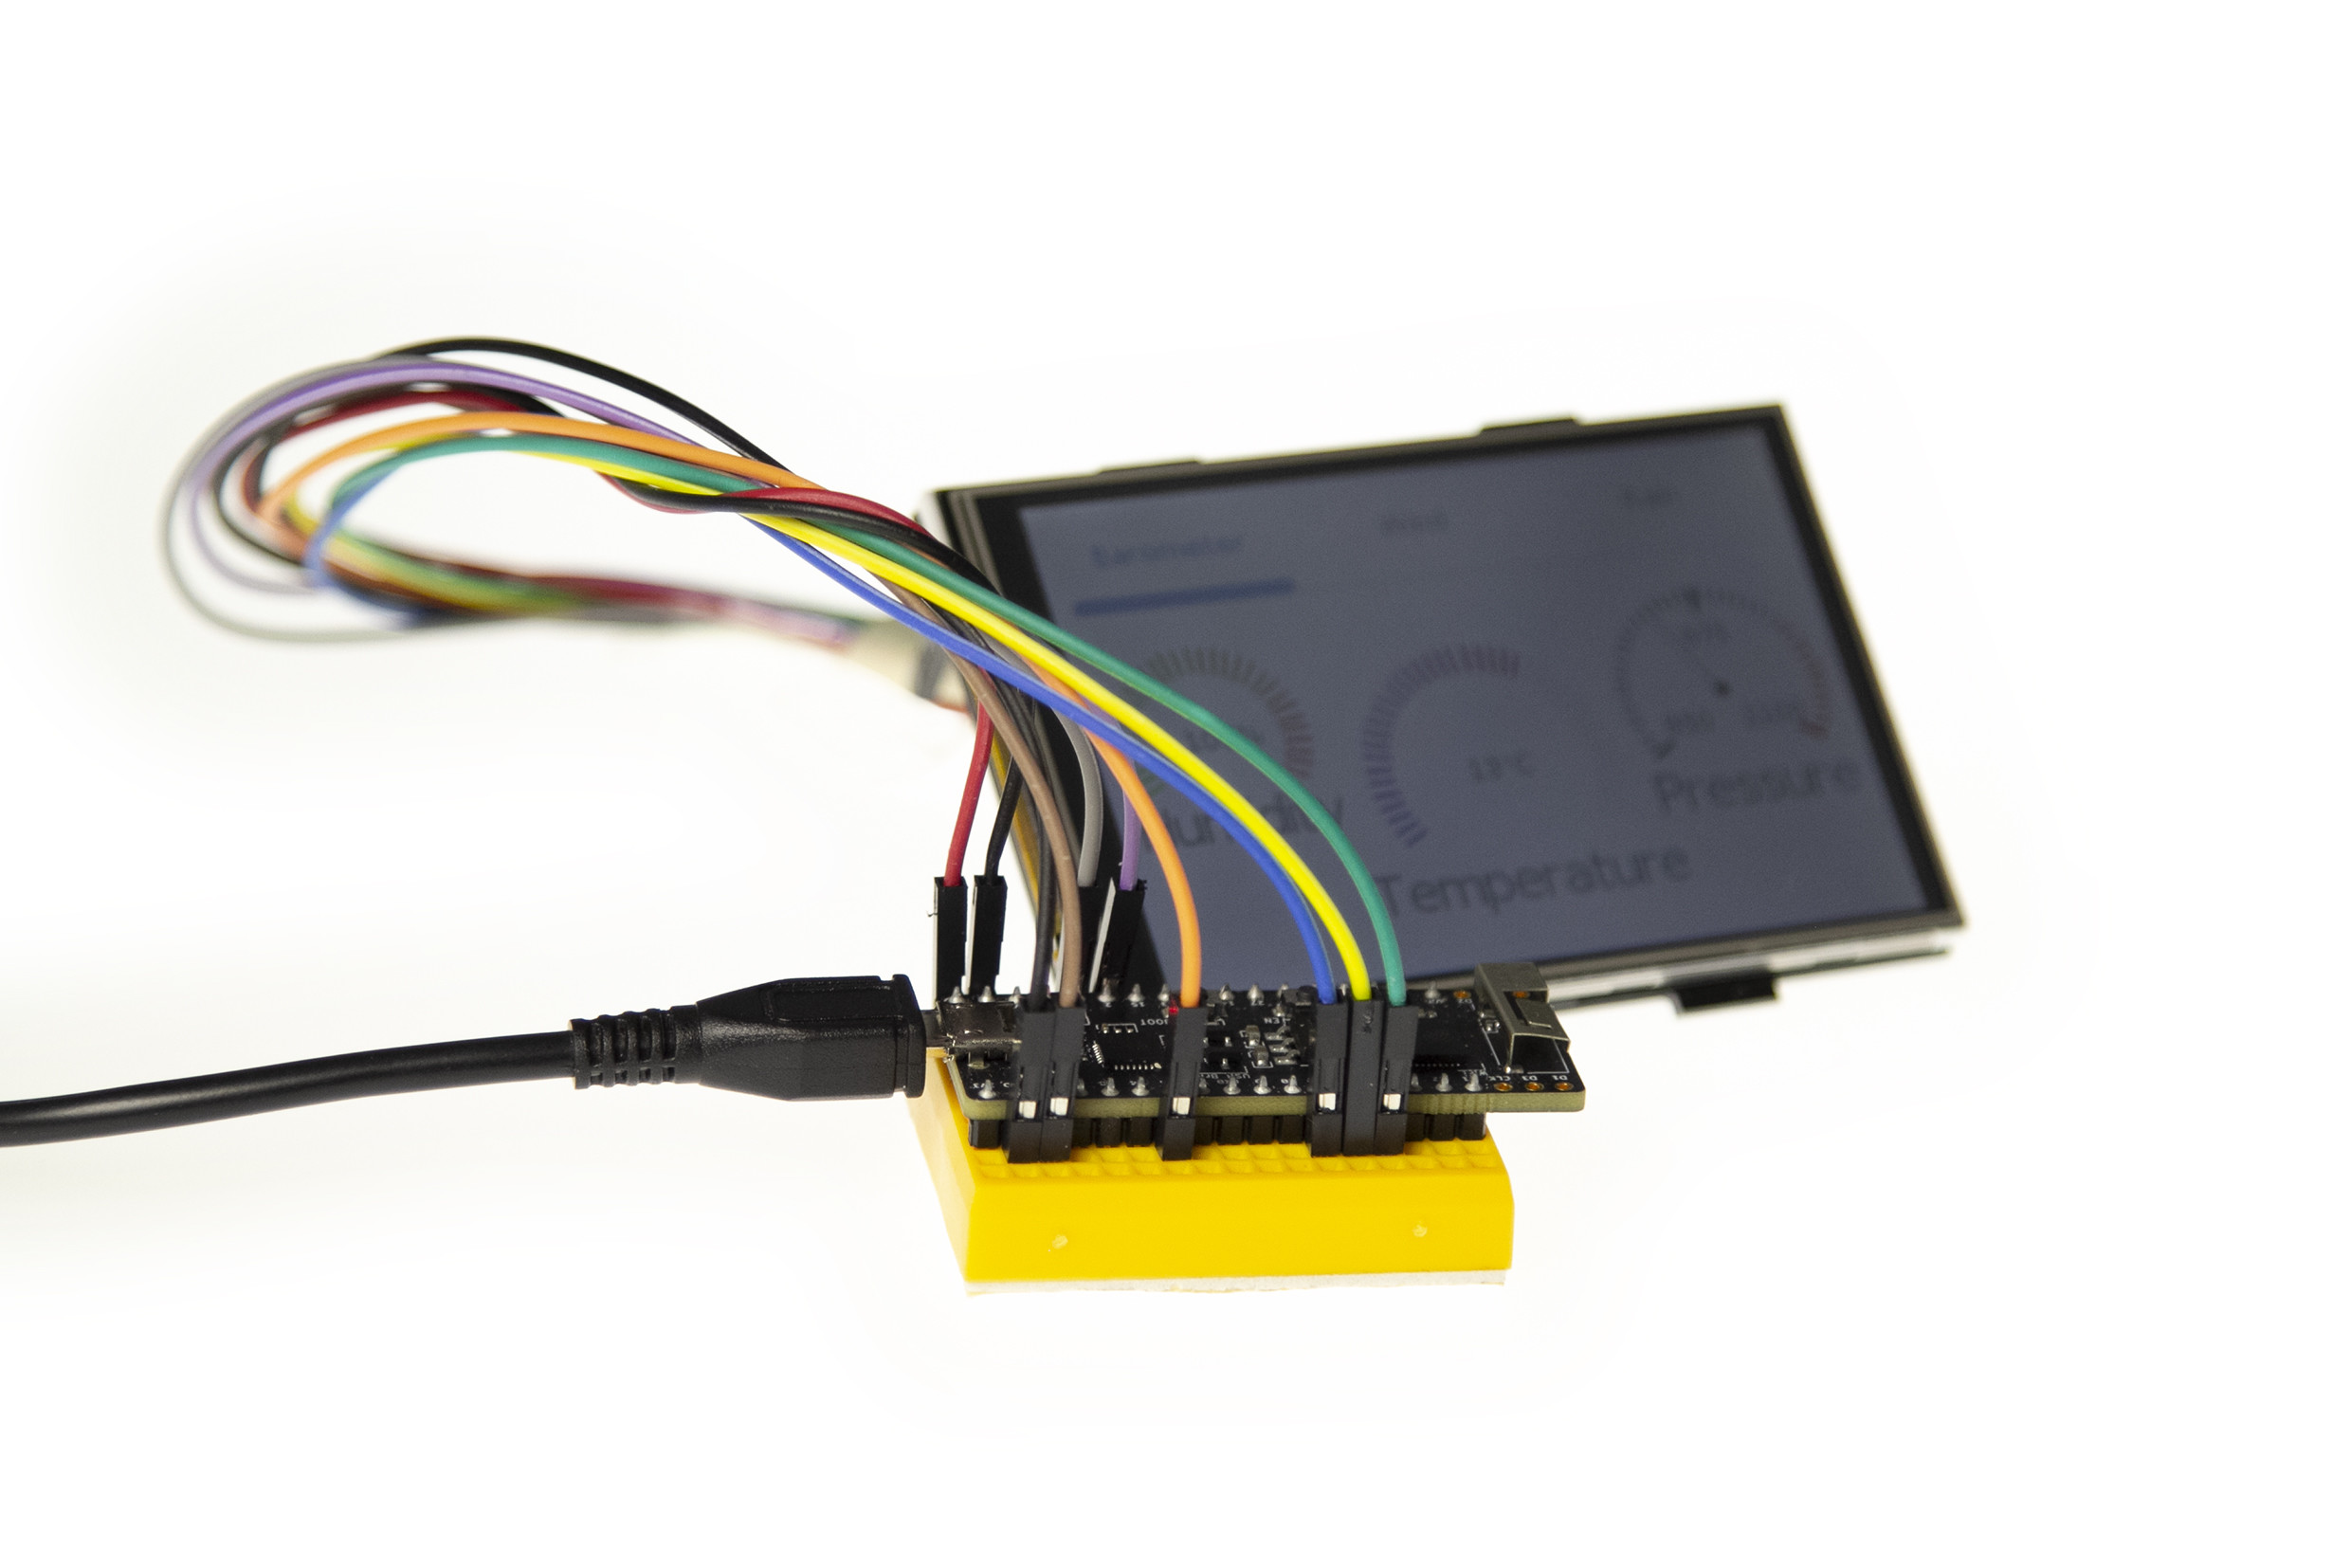
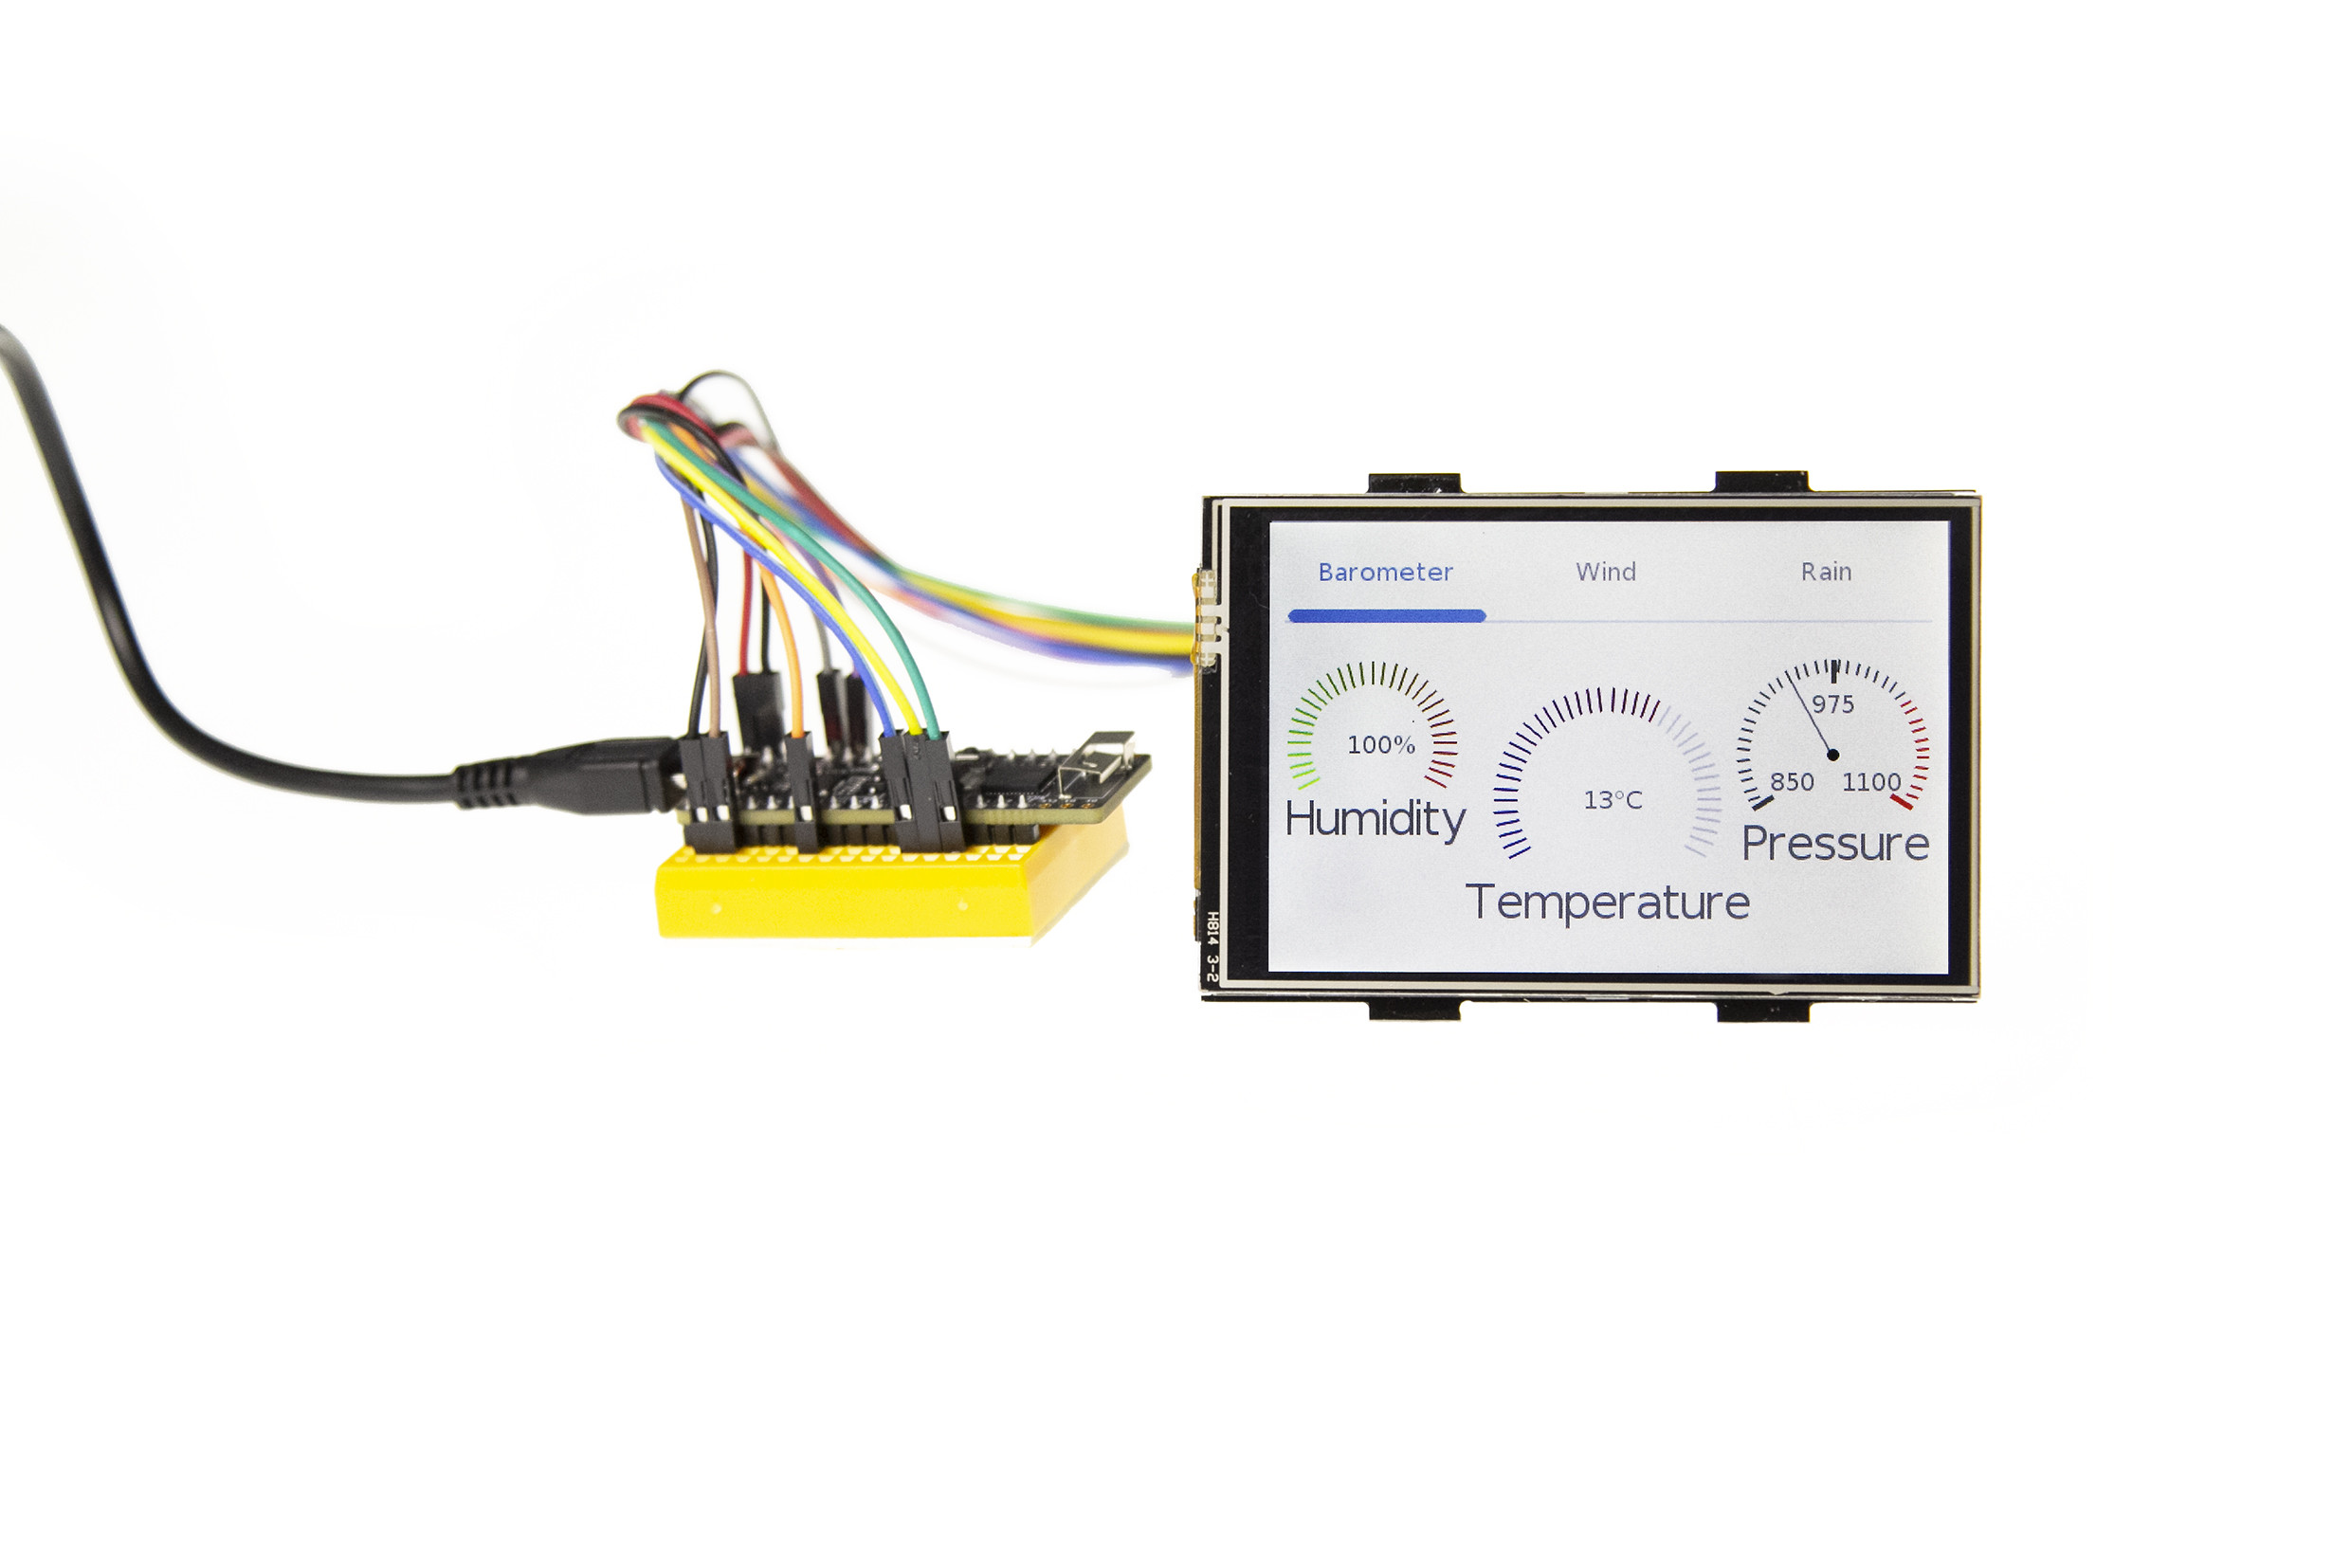
An ESP32 module is easily available. You can use modules like an ESP32 PICO D4, an ESP32 DevKitC, or a derivate board. The display offers a selection between a serial interface and parallel control, which then uses almost all IOs of the ESP32. Since the price also plays a role, a common 3.5" LCD for the Raspberry Pi is used. Most cheap displays like the 3.5" JOY-iT are connected via SPI and work with 3.3-V levels on the signal lines. They are therefore perfectly suited for a pin-saving link to an EPS32 board. In addition, they already have an integrated touch controller that can be connected via SPI.
The SPI displays intended for RPi, however, are limited in terms of speed at which data can be transferred to the display. Anyone who has ever experienced such a display in action on an RPi already feels the slightly sluggish screen update.
Note: LittlevGL does not provide display drivers, only ‘higher’ functions for drawing objects. It is up to the creator to develop the appropriate hardware-related routines. But even that doesn’t require reinventing the wheel, since most display controllers benefit from ready-made libraries. Here the Arduino TFT_eSPI library is used, which also supports 3.5" displays for the RPi.
Hardware
The following hardware is required to replicate the project (Figure 1):
- ESP32 DevKitC 32D or ESP32 PICO kit V4
- 3.5" Touch-Display for Raspberry Pi from JOY-iT
- Small breadboards & jumpers
Software
The required software is also orderly. In addition to the compulsory Arduino IDE and board support for the ESP32, the Arduino versions of the LittlevGL and TFT_eSPI libraries are needed.
In order to install and manage both libraries comfortably, the following two address lines must be entered in the Arduino IDE under Preferences Additional Boards Manager URLs:
https://github.com/littlevgl/lv_arduino/library.json
https://github.com/Bodmer/TFT_eSPI/library.json
These allow searching and installing LittlevGL and TFT_eSPI via the Library Manager. Then check if the Arduino library folder contains ‘TFT_eSPI’ and ‘LittlevGL’.
As already mentioned, both libraries are needed. LittlevGL takes care of the UI, i.e. the animation and arrangement of objects, the management of several scenes, and the rendering of the displayed graphics. The result is a bitmap. This data is then transferred from TFT_eSPI to the display hardware in a suitable way. These libraries therefore abstract from the actual display used.
More displays
TFT_eSPI not only supports SPI displays for the RPi, but others too based on the following controllers: ILI9341, ST7735, ILI9163, S6D02A1, HX8357D, ILI9481, ILI9486, ILI9488, ST7789, and R61581.
This supports many common colour displays. If a RAiO-based controller such as the RA8875 is used, the RA8875 library from Adafruit can be used instead. Adjustments are necessary to connect LittlevGL. In addition to colour displays, monochrome types can also be used in conjunction with the u8g2 library . However, the following text refers to the common 3.5" SPI LCDs for RPi.
A homebrew driver
If you are using a display with a controller lacking Arduino driver support, you need to know what functions need to be provided. This knowledge is also helpful for porting and linking.
Basically, it is sufficient to write your own driver capable of setting individual pixels on the display in a defined colour. LittlvGL expects a function like this:
/****************************************
* Function : disp_flush_data
* Description : Sends pixels to the display
* Input : lv_disp_drv_t *disp, int32_t x1, int32_t y1, int32_t x2, int32_t y2, const lv_colour_t *colour_array
* Output : none
* Remarks : none
****************************************/
void disp_flush_data(lv_disp_drv_t *disp,
const lv_area_t *area, lv_colour_t *colour_p){
/* Here: grab the pixel and send it to the display */
/* Inform the library after job is done */
lv_flush_ready(disp);
}
This function is passed to LittlevGL as a function pointer. For parameters it receives the start and end coordinates of the drawing area to be filled as well as a pointer to the image data. The actual setting of the pixels depends on the driver for the respective display. However, it can happen that the colours desired by LittlevGL have to be converted for the display (e.g. from RGB to BGR). That’s as far as the abilities of the drawing routine have to go. On the other hand, there are solutions for hardware acceleration, such as the DMA2D engine of some STM32 controllers.
Touchy
This should clarify how a graphic is displayed on the screen. What’s missing is the processing of the data from the touch controller. For that, we have a LittlevGL function which reads and processes the coordinates of a possible touch depending on the device. RPi displays are usually equipped with an XPT2046 touch controller, which is connected to the SPI bus as an additional slave. Unfortunately, this cannot be read with a clock rate higher than 2.5 MHz. Since the display and its controller run at a clock rate of 20 MHz (at room temperature, up to 26 MHz), the bus clock rate needs adjusting during access and then get reset to the original clock rate. The TFT_eSPI library also helps here, because it not only offers XPT2064 support, but also automatically takes care of the necessary clock switching.
If you do not use touch operation, you can also operate the UI through a mouse, keyboard, rotary encoders, or buttons. Of course, these input methods also require suitable drivers. They have to be registered in LittlevGL.
Image composition
First, a word about the strengths of LittlevGL: it is advantageous that the source code is also available. This facilitates the debugging of your own code. In addition, the library is well documented and developed out actively. Even beginners can use the examples to quickly achieve their first sense of achievement and design interfaces. From simple labels, buttons and tables to dropdown lists and gauges — a wide range of controls is provided. Windows and note boxes as well as themes for the appearance are also provided in order to be able to adapt the GUI even better to one's needs. The documentation describes all elements in detail. At [1], functions of the library and their interaction are demonstrated. LittlevGL does not yet offer any basic functions for setting pixels or drawing lines. That’s due to the type of image generation: If an element changes, the new screen area to be drawn can be determined and the buffer prepared in the internal RAM. The image is then sent to the display. Consequently, not just a line needs to be present as an object, but even individual pixels. This restriction makes it much easier to redraw areas on the screen.
The technical details of image generation and display are now available: If you want flicker-free and interference-free animations or screen updates, you could first prepare the complete image in the RAM of the controller and then transfer this data to the display. In this case, we would be dealing with 307 kB of data. You could also transfer all elements directly to the display and use less RAM. The latter complicates a flicker-free display and hinders effects like antialiasing, transparency and shadows.
A compromise is to mirror a part of the screen in RAM. With only a little more than 10% of the memory required for the entire image, you get all the features mentioned. For a display with 480 × 320 pixels at 16-bit colour depth that would be ‘only’ 30.7 kB of RAM — for an ESP32 that's a lot, but it can handle it.
In the current version 6 of the library, the memory area is not communicated by a #define, but instead has to be provided by code. This procedure is especially useful if additional external RAM is available and is to be used.
In our demo we limit ourselves to a static allocation of an area in the ESP32 memory, which keeps the code simple:
//Memory for the displaybuffer
static lv_disp_buf_t disp_buf;
static lv_colour_t buf[LV_HOR_RES_MAX * 10];
This memory is allocated to the display in the function hal_init() with the following line:
lv_disp_buf_init(&disp_buf, buf, NULL, LV_HOR_RES_MAX * 10);
With other microcontrollers the possibilities and priorities need to be considered, because many devices either have considerably less RAM available, or would have to address external RAM through a bag of tricks. In addition to the available RAM, other aspects such as the available computing power or multi-threading are also relevant. LittlevGL unfortunately does not allow multi-threading, so all access must be from the same thread as the lv_task_handler() function. The required computing power depends on how much interaction and drawing takes place on the display and whether and how animations are used. Thanks to its two processor cores, an ESP32 has enough computing power for a GUI.
Experiments
If you want to experiment now, be wary of the pitfalls. A setup example is described below for easy-peasy commissioning. An ESP32 D4 PICO board occasionally has slight startup problems due to the additional load of a display. An additional 10-µF capacitor between 3.3 V and GND delays booting until the voltages are within a defined range.
The connection of a display to an ESP32 board should follow the allocation in Table 1. This would prepare the hardware. Now the configuration and the software testing follow. First, we deal with the library TFT_eSPI as the actual display driver and then with the configuration of LittlevGL.
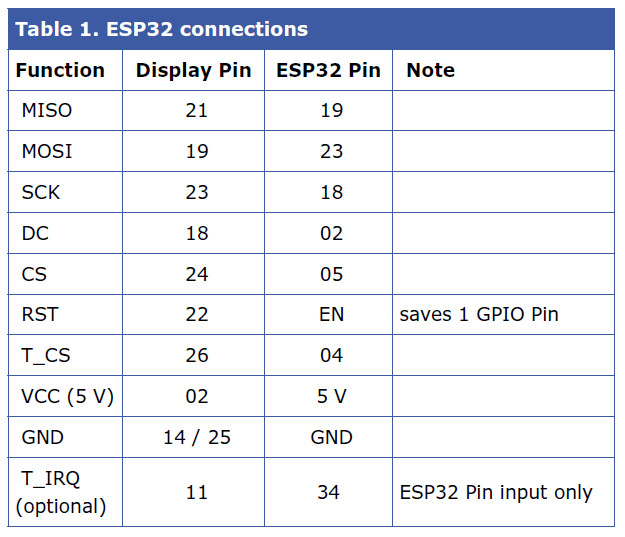
Concerning the display driver, to be able to adapt the file User_Setup.h to the display used, you have to look for the folder TFT_eSPI in the library directory of the Arduino IDE. The following #defines have to be present for the display used:
#define RPI_ILI9486_DRIVER // max. 20 MHz SPI
#define TFT_MISO 19
#define TFT_MOSI 23
#define TFT_SCLK 18
#define TFT_CS 05 // Chip select control
#define TFT_DC 02 // Data Command control
#define TFT_RST -1 // set TFT_RST to -1 if display RESET is connected to ESP32 RST
#define TOUCH_CS 04 // Chip Select (T_CS) of touch screen
#define SPI_FREQUENCY 20000000
// An XPT2046 requires a lower SPI clock rate of 2.5 MHz:
#define SPI_TOUCH_FREQUENCY 2500000
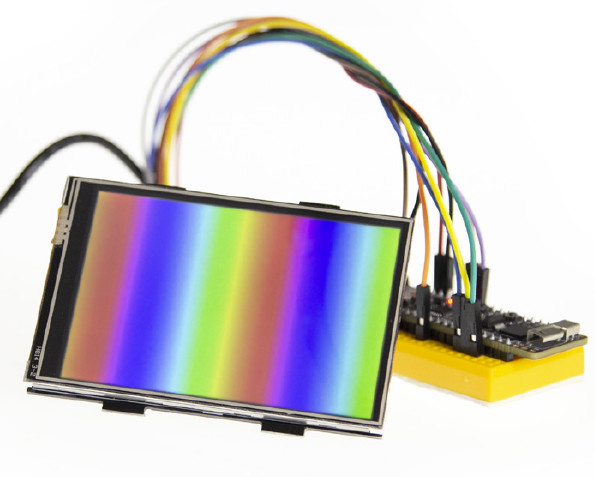
Meaning: the GPIOs used are defined and a 20-MHz SPI clock serves as safe initial value for the display. 2.5 MHz is suitable for the touch controller. For testing we use an example (selection: TFT_eSPI 480x320 Rainbow480), which outputs the rainbow colours once. If everything is compiled and connected correctly, the display should look like Figure 2. At this point, we have the hardware basically ready for use.
The next step is linking LittlevGL to the display driver and creating its own HMI (Human Machine Interface). In order to use LittlevGl, the configuration should be adapted first. To do this, look for the littlevGL folder in the Arduino library directory. In the file lv_config.h, adaptations to the display used are made and the available elements of the library are set. At the start of the file you will find the settings for the memory management.
The line:
#define LV_MEM_SIZE (64U * 1024U)
defines the RAM reserved for GUI objects. At the specified value of 64 kB, the linker will later complain that such an amount cannot be provided. With static reservation (at compile time), the non-continuous memory area of the ESP32 becomes noticeable. You could now reserve blocks at runtime through malloc and free. Since this measure holds other dangers, the matter is approached differently. Change the line like so:
#define LV_MEM_SIZE (24U * 1024U)
This is enough for our first steps.
The display has a resolution of 480×320 pixels. The corresponding #defines are:
/* Horizontal and vertical resolution of the library */
#define LV_HOR_RES_MAX (480)
#define LV_VER_RES_MAX (320)
The resolution in DPI (dots per inch) is calculated according to the following formula:
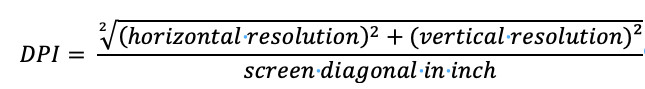
Substituting:
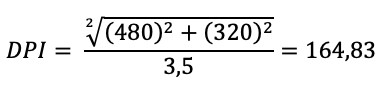
With integers being output:
#define LV_DPI 164
So much for the basic setting. For first tests, the remaining settings remain untouched; the changes are saved. In the Arduino IDE you can now select the example ESP32_TFT_eSPI under LittlevGL and upload it to the ESP32 board. If everything is configured correctly, “Hello Arduino!” should show up on a white background on the display.
So, the driver and LittlvGL cooperate well. However, the touch controller of the display has not yet been read and this data has not been transferred to the library. The following are the basic code parts allowing you to can create a basic framework for your own application. For this purpose, the example ESP32_TFT_eSPI from the LittlevGL library, which just got loaded into the ESP32, is examined more closely.
In the setup() function, after the initialization of the library in line 63 using lv_init() and the TFT in lines 69 and 70 with tft.begin() and tft.setRotation(1), lines 73 and 74 with the initialization of the structure lv_disp_drv_t follow. This structure is given a function pointer for writing to the display, and is subsequently registered in the library.
A similar procedure can be found in the dummy touch driver in lines 80–84. The last step is to provide a time base for the library using 'Tickers'. Here, a function is called in the specified interval of 20 ms. Each time, a timer is increased by 20 ms. Finally, a button will be created and assigned the text “Hello Arduino!” (lines 90–92).
Within the loop function, lv_task_handler() is now called so that the GUI can react to input or redraw the screen.
To avoid having to start from scratch with every project, the author has created a basic project in which the settings for the display of JOY-iT and its touch controller as well as the initialization of the components are made. In line 139 of the sketch, the orientation of the display is set with tft.setRotation(3). The image is thus rotated 270° from the starting position. If another display needs e.g. a rotation of 180°, the parameter should be set to 1.
GUI creation
With this basic framework, you can start to create your own GUI. This can be done directly on the ESP32 hardware, but compiling, uploading and testing takes time. The alternative is a PC simulator. Its installation requires familiarity with Eclipse. The installation is described here. It is a bit more difficult in Windows than in Linux or OS X. In the simulator, you can now try out the first steps without having to upload modified code to the hardware every time.
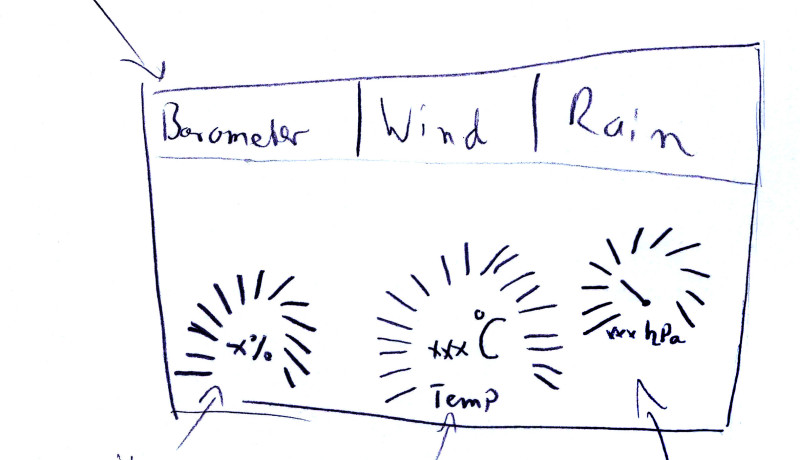
The first step is the design of the surface, which is best done using pen and paper (or tablet and pen) first, because sketches should be made before the first lines of code. Figure 3 shows an example of such a hand-drawn sketch. This makes it clear where which object gets placed, and which objects are used to navigate.
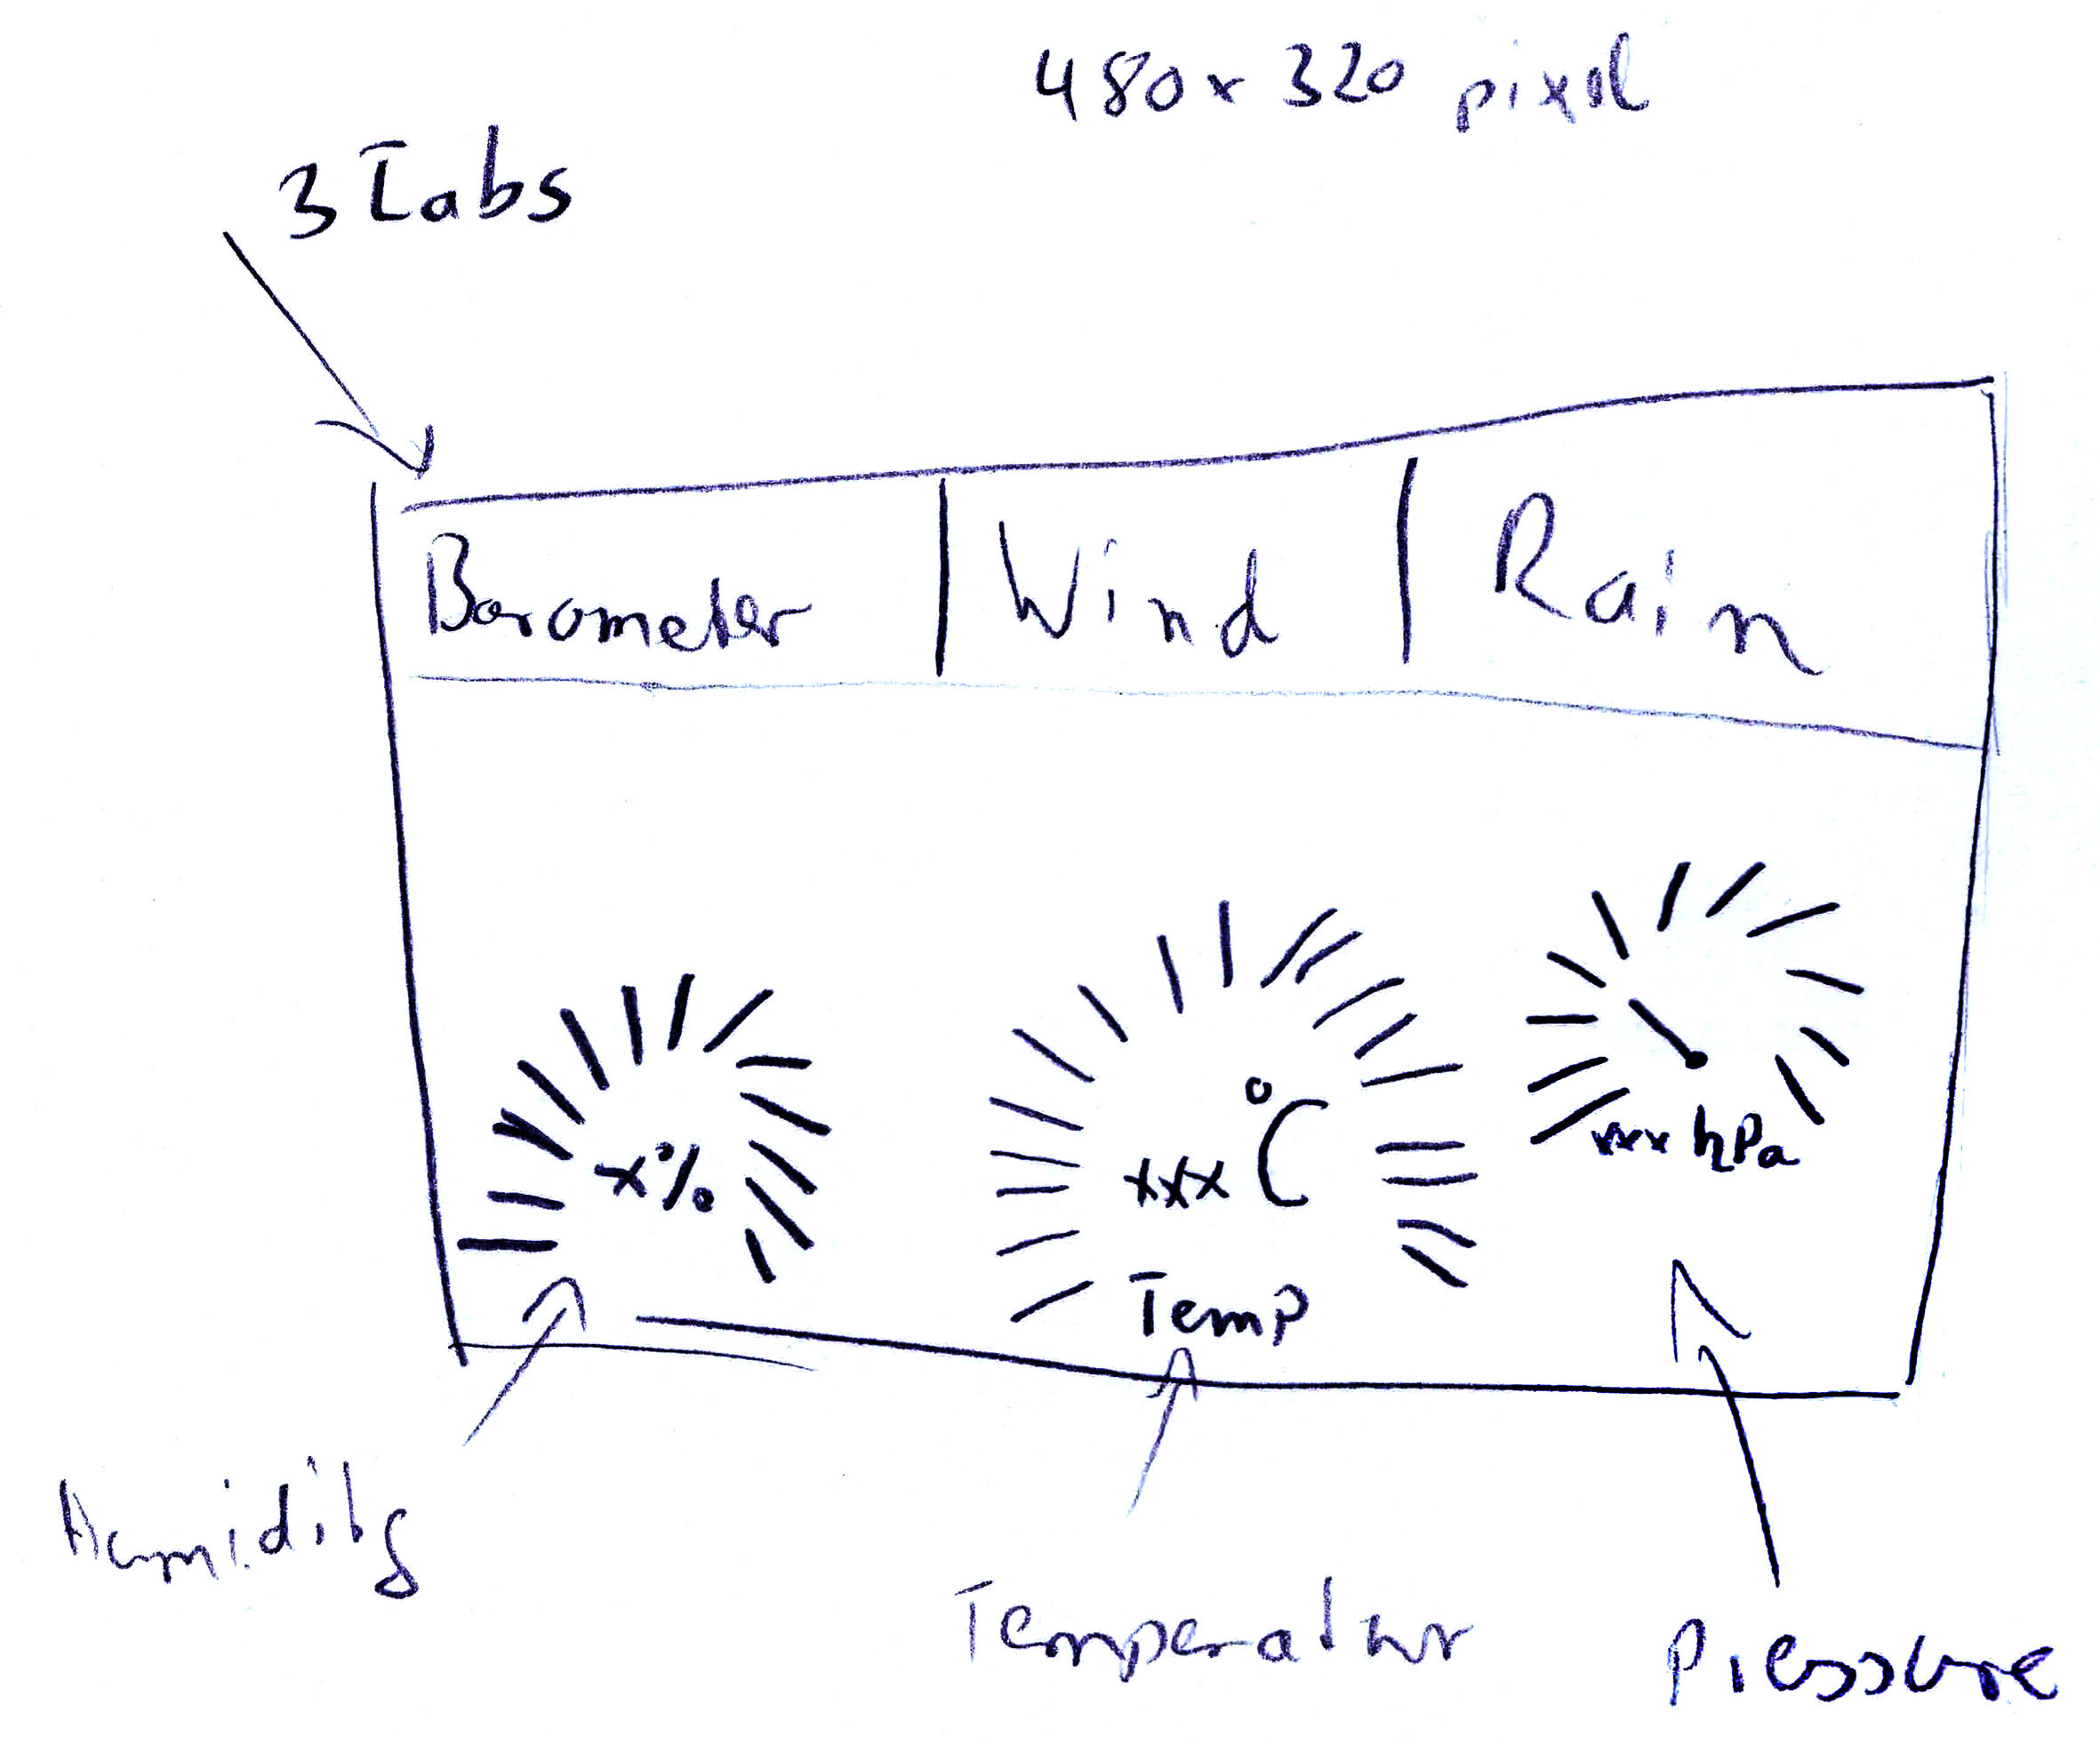
Since we’re talking about a weather station, a simple surface with three tabs is created for the display of the weather data. To keep the Arduino sketch clear, the functions and the creation of the GUI elements are stored in a separate file.
First, the scene is prepared and a tabview element is created, to which three tabs are added: Barometer, Wind and Rain. The following code is responsible for the preparation of the scene:
lv_theme_set_current(th);
/* Next step: create a screen */
lv_obj_t * scr = lv_cont_create(NULL, NULL);
lv_scr_load(scr);
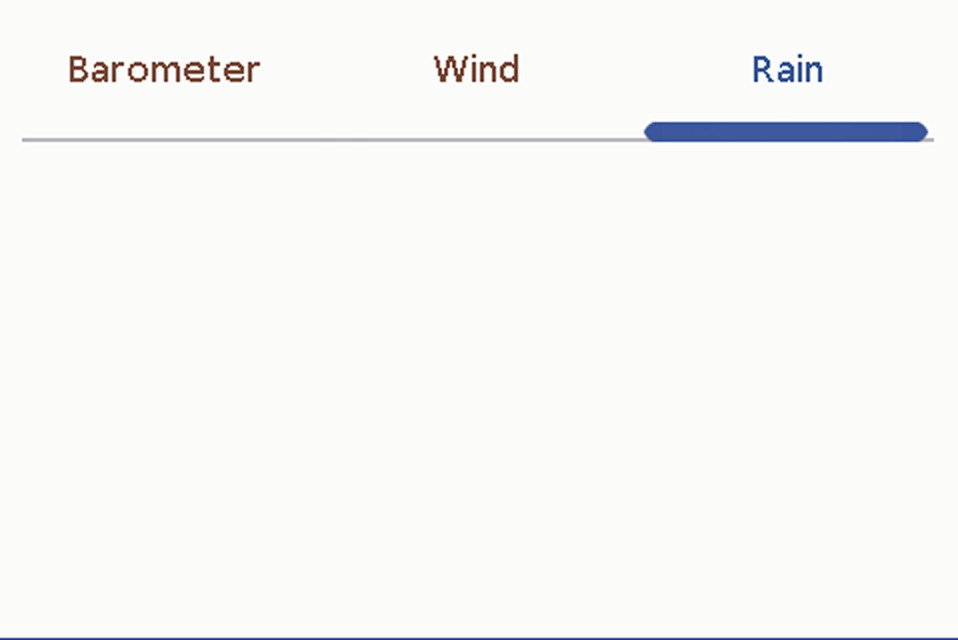
First, the theme is loaded, which was passed as a function parameter. An empty scene is then created and loaded. The Tabview element is assigned the complete screen size. The screenshot in Figure 4 shows the three empty tabs with the font settings specified by the theme. If you click on the name of the corresponding tab, a change of the tabs is indicated by the blue marker. Since the tabs are empty, you can't see more than this.
The first three tabs are created with the following five lines of code.
/* And now populate the four tabs */
lv_obj_t * tv = lv_tabview_create(scr, NULL);
lv_obj_set_size(tv, LV_HOR_RES_MAX, LV_VER_RES_MAX);
lv_obj_t * tab0 = lv_tabview_add_tab(tv, "Barometer");
lv_obj_t * tab1 = lv_tabview_add_tab(tv, "Wind");
lv_obj_t * tab2 = lv_tabview_add_tab(tv, "Rain");
At first, they have no content yet and are therefore provided with titles afterwards.
Weather display
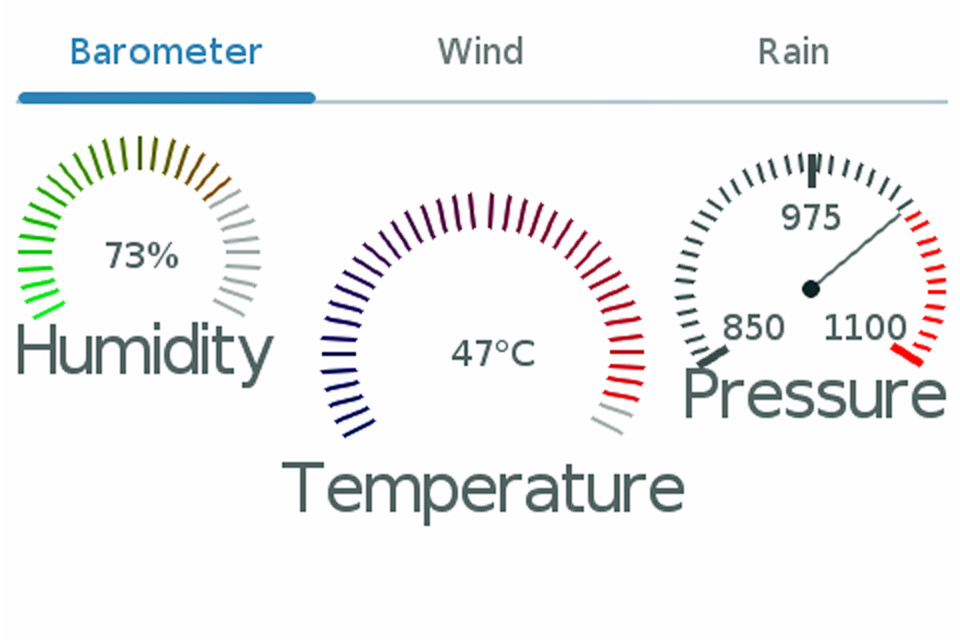
Let’s start with the barometer: three values for humidity, temperature and air pressure should be displayed here. For humidity and temperature, lv_lmeter and label are used, indicating the value and name of the measured variable. For the humidity, lv_gauge is used. Conveniently, you can still influence the look of the elements at runtime by styles and so individualize each element.
The Autofit function of the library must be taken into account when arranging elements. Consequently, you should arrange the elements appropriately or disable Autofit. Elements can be positioned from several original coordinates — an overview can be found here. The individual elements can have parents, i.e. objects on which their position depends. This results in elegant dependencies of the positions, which also realigns all children during a parent shift. In the code, the created elements cannot be accessed directly later. For LMeter and Gauges we therefore use pointers that can be accessed globally. In the example code
lv_obj_t* humidity_lmeter
lv_obj_t* humidity_label
lv_obj_t* temp_lmeter
lv_obj_t* temp_label
lv_obj_t* air_pressure_gauge
it is noticeable that functions like lv_ L-meter create only return pointers. The question now is where memory is reserved. This is buried a bit deeper in the library. The expression:
# define LV_MEM_SIZE (24U * 1024U)
creates a fixed storage pool for the graphic elements. Each time a Create function is called, some memory is taken from the pool and reserved for the graphic object. The result of the operation is a pointer to the memory address, which is used to change the properties of the object. If the memory runs out at some point — this can happen with dynamic surfaces — an error is triggered in the library and an endless loop is created. The ESP32 stops completely.
The pointers are only valid in the function you are currently in. If you want to access an element later without detours, the pointers have to be stored outside the function. For the sake of simplicity, we use a few global variables. In serious applications, however, it is not advisable to use global variables.
Through Pointer, you can then write new values to the displays. One example is the UpdateTemperature function. The display element Lmeter expects a value between 0 and 100, but the size has a value range of ±50°. The temperature must therefore be offset by 50. 0° then corresponds to a Lmeter value of 50. In addition, the current temperature is displayed as text. This is done by snprintf and a small local buffer, which is written as new text into the text field. If the text length changes, the text is not automatically realigned. The alignment must be done again after setting the text. To do this, lv_obj_align is called again with the parameters for the label. Humidity and air pressure are treated very similarly. Figure 5 shows a screenshot of the finished tab and Figure 6 shows what it ’really‘ looks on the LCD.
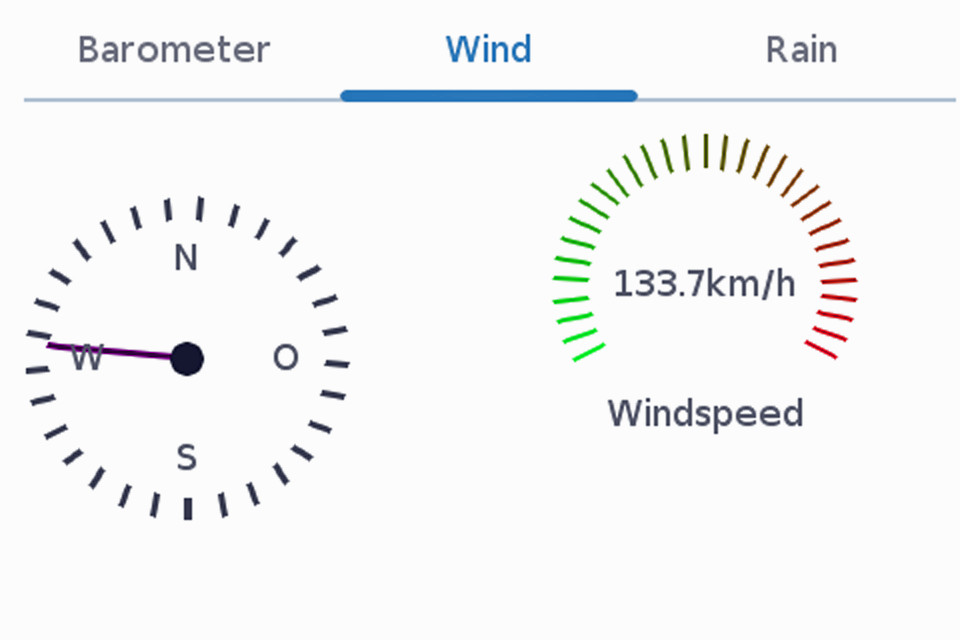
The first tab is now filled with content. The second tab is similar, but the wind direction display as a compass dial requires a little more effort. Here a Gauge acts as Parent for four labels. In the code, a Gauge with 0–359° is created first. This is followed by four labels, which are forwarded to the compass as a Parent. The labels are defined in relation to the centre of the compass. This results in the four points of the compass. The pointer points in the direction from which the wind comes. With the Gauge, 0° does not result from the value 0, but from 180. For the display of the wind speed, again an Lmeter with similar structure is used as with the barometer. Notice that processes are repeated for the creation of the elements. First, a style is created for the object, then the object is created, and finally its properties get assigned to it. The finished result can be seen in the screenshot of Figure 7.
In the case of rain or precipitation, the values are displayed differently. Here the values are represented in text form as well as in a diagram, from which the temporal process results. The texts are realized as described before: First, styles and objects are created — then the values are assigned. For the course of the rain volume a line diagram is suitable, which requires no more tricks to label the axes since version 6. To update the values, it is not necessary to move each data point individually, because lv_chart_set_next does this. A new value is passed to the diagram once per hour. The update of the precipitation volumes is done just as with other texts as well as by an internal function. Figure 8 shows a screenshot with pseudo data of the progression and the precipitation values.

For the data connection of the display, code from the Monster LED Clock project got recycled, since data already coming from a broker via MQTT is processed here. The code expects the broker to send a JSON string containing the values for humidity, temperature, air pressure, wind direction, wind speed and precipitation. When new data comes from the broker, it is entered into the corresponding elements. However, you need to make sure that this does not happen through different threads. With the configuration, there are no big differences to the LED Clock project except for the missing time setting. WLAN and MQTT settings were simply adopted; only the weather station and the display have to be set to the same topic. From then on, the values are displayed directly on the screen. An exception at this point is the rain quantity, because here only the current rain quantity of the weather station is output. The calculation of hourly values and the trend are unfortunately not yet implemented with the weather station. As soon as this has materialized, however, these values are also updated on the display.
Conclusion
With this example, some basic functions of LittlevGL were demonstrated hands-on. The corresponding code for this demonstration can be downloaded free of charge by clicking on DOWNLOAD ATTACHMENT below. As already mentioned, LittlevGL provides much more functions and animations as well as design possibilities with tables, lists and dropdown menus.
If you like the simplicity of using this library, you might want to try LittlevGL in your own projects. After all, an EPS32 module in combination with a touch display is a platform that can be used quite universally and offers a lot of performance for little money.
Want more great Elektor content like this? Then take out an Elektor Membership today and never miss an article, project, or tutorial.
Discussion (0 comments)