

Display ESP32 sensor readings on openSenseMap
December 11, 2018
on
on
In my series of articles about My journey into the Cloud I used, among other things, the ESP32 Pico Kit hardware to send sensor measurement data to various cloud platforms. There it is possible to display the sensor data on a personalized web page that you can customize as necessary to fulfil your requirements. It is quite possible to register millions of sensors to cloud platforms such as Amazon Web Services (see instalment 25), which is also useful for industrial applications. It is obvious that reliable encryption is essential for this sort of work. In instalment 25 we showed how the ESP32 can send sensor data to the AWS over the TLS transport option using Secure-MQTT.
Transferring measurement values using HTTP is just one way to publish them to openSenseMap. It is also possible use MQTT, and you have probably already guessed that I chose that method. In contrast to the other cloud platforms I have tested so far, however, openSenseMap does not have its own MQTT-Broker, just an MQTT-Client. This then subscribes to the sensor messages sent using the topic specified by the user via a publicly accessible Broker, which the user must also specify.
After registering at https://opensensemap.org/ and creating a first device (which in my case I called ‘senseBox’), I specified Edit -> MQTT at the menu option.
As the screenshot shows, I selected the Mosquitto test broker (test.mosquitto.org) and named the Topic ‘/ ElektorMyJourneyIoT / SenseBox / light’.
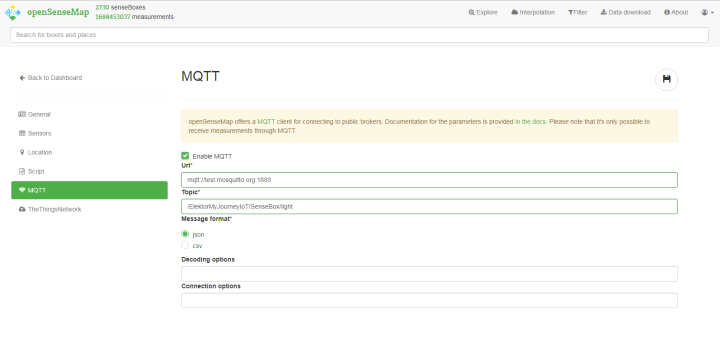
I called my SenseBox ‘LIGHT_ESP32’, and specified ‘Light’ as the measured parameter (it only has the one sensor) with the units as ‘RAW’. The latter was chosen because I haven’t actually calibrated the light sensor readings so raw ADC digital values are sent to the Internet.
VALUE is the measurement value. The quotation marks are not strictly necessary if the value consists of numbers only. A valid payload would, for example, look like:
The digital values (LDR voltage) measured by my ADC ranges between 0 and 4095, which I truncated to 0 to 63 by bit-shifting.
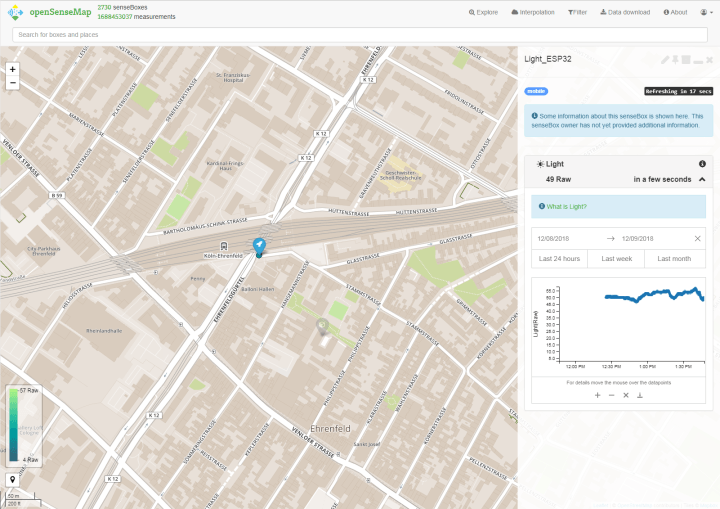
In the screenshot you can see the results of my efforts. To keep my home location private I moved the sensor box to nearby Cologne-Ehrenfeld station. I also noticed there is a SenseBox at a school in the vicinity which shows weather data. I really like the whole concept of openSenseMap: anyone can collect environmental data for anyone else to use and the map display is also practical and useful. A graph showing the measurement values is displayed alongside the map. The zoom function makes it possible to inspect interesting sections of the graph curve more closely. The screenshot shows this to good effect.
By the way: If you would like to setup a small weather station of your own and publish the readings on openSenseMap, Elektor can help here. Issue 1/2 2019 of the Elektor magazine contains the ‘ESP32Weather Station’ project. Go to the Elektor shop where all the necessary weather station parts (including wind and rain gauge) and a kit for an ESP32-based controller board are offered. The whole kit is all you need to publish data on openSenseMap.
I have therefore expanded the configuration form to accept a total of 7 input parameters (plus the first parameter that allows you to control the red LED for testing purposes). In addition to the SSID, PASSWORD, BROKER ADDRESS and DEVICE ID, that we are already familiar with you will also find the SENSOR ID / TOKEN parameter as well as TOPIC and PAYLOAD. For the DEVICE ID enter the Client-ID that was used to establish the communication with the MQTT-Broker, in our case this is 'ElektorMyJourneyIoT'. For SENSOR ID, enter the sensor ID you received from openSenseMap.
The topic and payload of each message are assembled on each cloud platform from the above parameters and the sensor value. In order to be able to formulate this for general purpose use I have produced a short piece of code. The expression $D$ is replaced by the entered device/client ID and $S$ by the sensor ID. $V$ is used for the measurement value (sensor data) and $N$ for the sensor name (in my case 'light'), which are passed in the void PublishSensorDate(String SensorName, byte SensorDate) function. The hash character is replaced with quotation marks.
In our case the PAYLOAD is entered in the Web form as:
As the TOPIC I can then enter:
If you want to closely follow the approach i used here you should:
Have fun experimenting with openSenseMap!
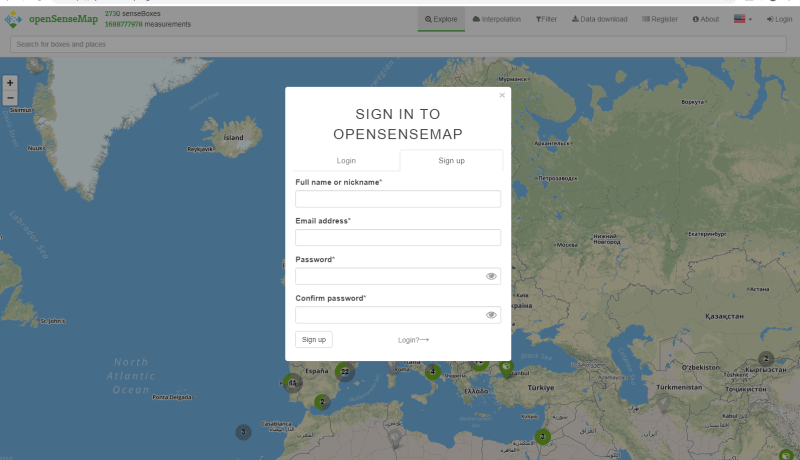
Open source sensor data
The cloud platform I will be trying out in this review serves a very different purpose. The sensor data, which is collected and displayed, is explicitly accessible to anyone who wants to use it. The idea is to inspire students with an interest in environmental metrology (or even more generally for the purposes of research and technology), the Institute of Geoinformatics of the University of Munster some years ago put together a hardware kit that includes an Arduino board together with various sensors. This SenseBox is now in fact available as a complete kit to anyone interested in taking and publishing measurements of the environment. A cloud platform called openSenseMap has also been developed for use with the kit. After a simple login, users can upload measurement data and make it publicly accessible; the physical location of all the registered SenseBoxes can be viewed on a map based on OpenStreetMap. It’s not even necessary to use dedicated SenseBox hardware, data recorded using a different type of board can also be sent to the Internet. OpenSenseMap provides a so-called REST interface through which data can be uploaded or retrieved. To publish sensor data, measured values are sent to the server using standard HTTP protocol. A feature of the system which is ideal to get beginners up and running quickly is that when registering a SenseBox you will receive a sketch that will send the measurement data using this method. All you need to do is add the reading of your own sensors. A good guide for beginners can be found at https://edu.books.sensebox.de/ in English or German.Transferring measurement values using HTTP is just one way to publish them to openSenseMap. It is also possible use MQTT, and you have probably already guessed that I chose that method. In contrast to the other cloud platforms I have tested so far, however, openSenseMap does not have its own MQTT-Broker, just an MQTT-Client. This then subscribes to the sensor messages sent using the topic specified by the user via a publicly accessible Broker, which the user must also specify.
After registering at https://opensensemap.org/ and creating a first device (which in my case I called ‘senseBox’), I specified Edit -> MQTT at the menu option.
As the screenshot shows, I selected the Mosquitto test broker (test.mosquitto.org) and named the Topic ‘/ ElektorMyJourneyIoT / SenseBox / light’.
I called my SenseBox ‘LIGHT_ESP32’, and specified ‘Light’ as the measured parameter (it only has the one sensor) with the units as ‘RAW’. The latter was chosen because I haven’t actually calibrated the light sensor readings so raw ADC digital values are sent to the Internet.
A demo project
The hardware I used for my SenseBox is the ESP32 Pico Kit with red test LED, an RGB LED to indicate connection status, and an LDR connected to pin 36; details of the hardware and the main function of the software are described in instalment 23. The basis of the Arduino sketch that i will be running on the ESP32 is the software described in instalment 25 (Amazon Web Services) of the series. To make is suitable I need to implement the following changes:- Instead of TLS and Secure MQTT simple TCP and MQTT are used here, therefore TCPClient and MQTTClient classes are used instead of TCPClientSecure and MQTTClientSecure.
- When connecting to the MQTT broker, port 1883 is now used instead of 8883 for the same reason. As usual, the broker address must be entered by the user via the web page (the ESP32 web server and the configuration page delivered by it are described in detail in instalments 19 through to 22). The device ID from the web page is used as client ID. The client ID only has a subordinate meaning in OpenSenseMap, I chose ‘ElektorMyJourneyIoT’ here. Note: This device ID should not be confused with the ID of the whole SenseBox (I did not use the latter in the software).
- The Function void SendSensorDateToxxx(String SensorName, byte SensorDate)
is now called void PublishSensorDate(String SensorName, byte SensorDate).
This is where the topic and payload of the MQTT message are assembled, with which the sensor value is published. Since each cloud platform requires a specific format for both, the most changes were needed here.
{“SENSORID“:“VALUE“}
VALUE is the measurement value. The quotation marks are not strictly necessary if the value consists of numbers only. A valid payload would, for example, look like:
{“5bf000000000000000341“:30}
The digital values (LDR voltage) measured by my ADC ranges between 0 and 4095, which I truncated to 0 to 63 by bit-shifting.
In the screenshot you can see the results of my efforts. To keep my home location private I moved the sensor box to nearby Cologne-Ehrenfeld station. I also noticed there is a SenseBox at a school in the vicinity which shows weather data. I really like the whole concept of openSenseMap: anyone can collect environmental data for anyone else to use and the map display is also practical and useful. A graph showing the measurement values is displayed alongside the map. The zoom function makes it possible to inspect interesting sections of the graph curve more closely. The screenshot shows this to good effect.
By the way: If you would like to setup a small weather station of your own and publish the readings on openSenseMap, Elektor can help here. Issue 1/2 2019 of the Elektor magazine contains the ‘ESP32Weather Station’ project. Go to the Elektor shop where all the necessary weather station parts (including wind and rain gauge) and a kit for an ESP32-based controller board are offered. The whole kit is all you need to publish data on openSenseMap.
Flexible universal software
I could have ended the review here but I thought it would be helpful — rather than describing the changes needed to the downloaded sketch to enter your Sensor-ID — to write some configuration code. This will also be useful when programming a new sketch; it will not be necessary to make changes to the function that compiles the message Topic and payload for each different cloud platform (I'm always keen to expand my knowledge).I have therefore expanded the configuration form to accept a total of 7 input parameters (plus the first parameter that allows you to control the red LED for testing purposes). In addition to the SSID, PASSWORD, BROKER ADDRESS and DEVICE ID, that we are already familiar with you will also find the SENSOR ID / TOKEN parameter as well as TOPIC and PAYLOAD. For the DEVICE ID enter the Client-ID that was used to establish the communication with the MQTT-Broker, in our case this is 'ElektorMyJourneyIoT'. For SENSOR ID, enter the sensor ID you received from openSenseMap.
The topic and payload of each message are assembled on each cloud platform from the above parameters and the sensor value. In order to be able to formulate this for general purpose use I have produced a short piece of code. The expression $D$ is replaced by the entered device/client ID and $S$ by the sensor ID. $V$ is used for the measurement value (sensor data) and $N$ for the sensor name (in my case 'light'), which are passed in the void PublishSensorDate(String SensorName, byte SensorDate) function. The hash character is replaced with quotation marks.
In our case the PAYLOAD is entered in the Web form as:
{#$S$#:$V$}
The PublishSensorDate function then produces an expression such as:
{“5bf…341“:30}
As the TOPIC I can then enter:
/$D$/SenseBox/$N$
to produce '/ElektorMyJourneyIoT/SenseBox/light'.If you want to closely follow the approach i used here you should:
- Build the hardware described in instalment 23, the ESP32 Pico Kit is also available from our store.
- Download the software for the project, compile the sketch and program it to the board.
- Connect to the web server generated by the ESP32 and enter 192.168.4.1 in the browser (e.g. via a smartphone). Enter the SSID and password of your router network, the broker address test.mosquitto.org using the Topic name as above. After sending this, the test server connects to the ESP32 and sends messages, which you can see by the RGB LED flashing green.
- Register at openSenseMap und erhalten Sie die Sensor-ID. Configure MQTT with your ‘SenseBox’ as shown in the screenshot above. Now connect again to the ESP32 web page and enter the sensor ID and payload the above expression.
- The ESP32 now sends its sensor data to the web, which is received and displayed by openSenseMap.org.
Have fun experimenting with openSenseMap!
Read full article
Hide full article
Discussion (0 comments)