
Review: SmartPi – smart meter extension for Raspberry Pi
SmartPi user interface
The web interface showed three currents, three voltages and three frequencies. Strangely enough the three voltages were rather different even though they were connected to the same source by the same wire. Checking with a multimeter I found that channel 1 was right with its 238.5 VAC, channels 2 and 3 both were about 7 volts off with values around 245.5 VAC. Maybe this is due to the SmartPi expecting a three-phase signal? Also because of this power and cos phi were negative for channels 2 and three. I have not found a way to decouple the phases.At this point I let it run for a few days.
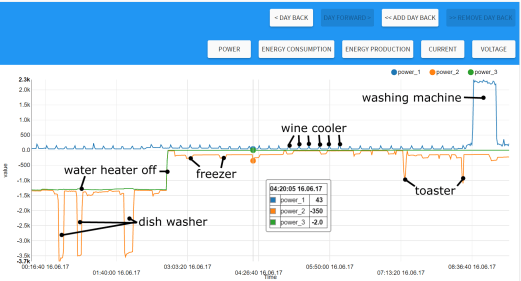
When the SmartPi has collected some days’ worth of data it is time to look at it and try to understand it. In my single-phase system the power graphs do not make much sense, only the current and voltage graphs can be interpreted easily. In this case it is better to export the data as a CSV file (separated with semi-colons, decimal point is a comma) and process it yourself in a spreadsheet.
Conclusion
The SmartPi is a Raspberry Pi extension board for makers, not a consumer product. The software supporting it is basic — three-phase only, configuration over SSH —, documentation is insufficient. People without RPi or Linux experience will be lost quickly. This is a shame as it should not be very difficult to add mains/phase setup, localisation, Wi-Fi configuration, password management, CSV-file setup, etc. to a configuration menu on web interface, and add a few paragraphs with clear pictures to the manual. Doing so would make the SmartPi interesting for a much larger audience. On the other hand, if you are looking for a platform on which to build yourself a smart energy consumption metering system, the SmartPi definitely is a good start.Read full article
Hide full article
Discussion (5 comments)