Got a microcontroller but no debugger? Or possibly a microcontroller that doesn't support a debugger? Then these tips are for you!
Got a microcontroller but no debugger? Or possibly a microcontroller that doesn't support a debugger? Then these tips are for you! While debuggers and their fancy integrated development environments (IDE) are clever and exceptionally helpful, there are times when they are of little or no help. These debugging tips provide a few ideas of how to know what is going on inside your microcontroller when there is no alternative way of looking.
While most microcontroller development boards come with an onboard debugger, there are still plenty that don’t. One of the advantages of a debugger is the ability to stop code execution, examine the content of variables, and step, line by line, through the code. However, some boards, like the Arduino Uno and Mega, don’t have built-in debugging support. There are also tiny, low pin count 8-bit microcontrollers, such as some of the Microchip PIC10/12/16 series, that don’t even support a debugger (there is a workaround using a debug header board).
Even with a debugger, some applications cannot be halted during operation. Devices communicating via USB or Ethernet cannot be paused mid-communication by a debugger, as this breaks the established link. The same applies to motor control or digital power supplies, where pausing the processor could result in a short circuit or high current draw through a MOSFET.
The Blinky LED
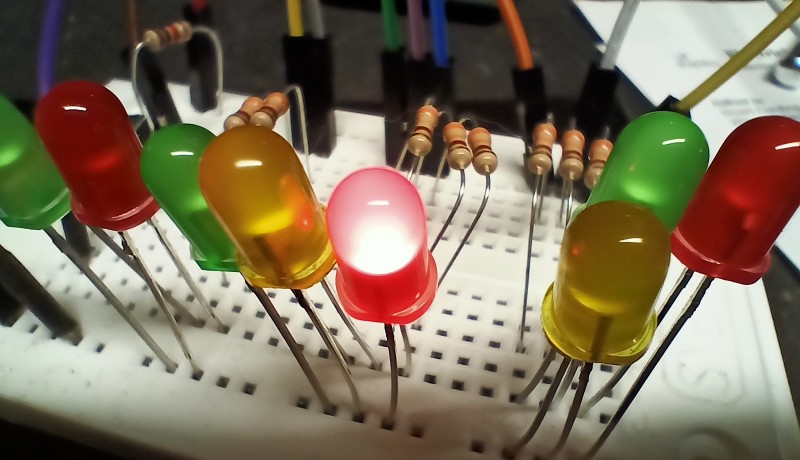
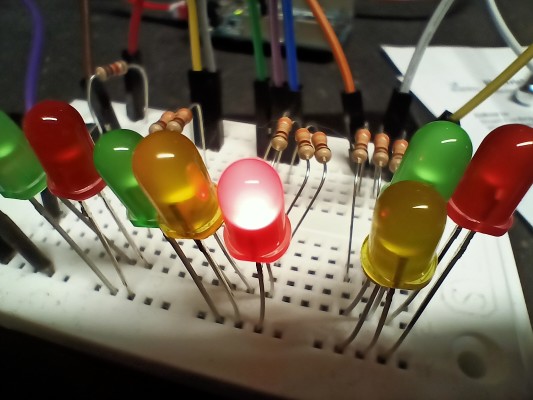
By far the simplest debug tool is a resistor and an LED of your choosing. Connected to a spare general-purpose I/O pin (GPIO), it can be used like a latch at a strategic point in the code to leave an electronic breadcrumb. There are a few examples of where this can help:
Interrupt routines: Datasheets are notoriously tricky to interpret, and anything to do with interrupts is especially so. Many peripherals have several interrupts. A serial interface may generate an interrupt when data is sent, when it is received, when its buffer is full, on a buffer overflow, and many other conditions. No wonder enabling the correct signal and attaching code to it is so difficult. Simply setting a GPIO pin high in the target interrupt routine can confirm if your code is being called.
switch and if/else statements: Writing logic in C/C++ is error-prone. Who hasn’t accidentally used & instead of &&? Without a debugger, you may wonder if a branch of code is being reached or if a decision is being decoded. Again, setting a GPIO pin high can reveal if the code was reached.
An LED suffices to indicate if a section of code has been reached.
The great thing about restricting yourself to just setting a GPIO is its code simplicity and speed. Most processors can perform this task in one or two instruction cycles, which ensures your code’s execution timing isn’t significantly impacted.
Unfortunately, some debug challenges are more complex. In such cases, you could start to toggle the pin used in several places. However, it is unlikely that you’ll still be able to see the LED turning off and on. If you are lucky enough to have an oscilloscope or logic analyzer, attach it to the pin, and you’ll be able to see what is going on.
The Modem Approach – Wired for Sound!
Depending on the issue’s complexity, you may be tempted to start toggling more pins to scope out the issue. However, with low pin count devices, there may be none spare. But, if your device features a pulse-width modulation (PWM) peripheral, you may have an alternative.
PWMs typically have two key configuration options; frequency and mark-space ratio. Once turned on, they toggle a GPIO autonomously of the processor at a frequency related to the device’s oscillator. Changing the frequency typically requires a write to a single register, so adding this debug code has minimal impact on code execution time, much like the LED approach. The mark-space ratio can be left at 50% or varied if this extra parameter helps the debug process.
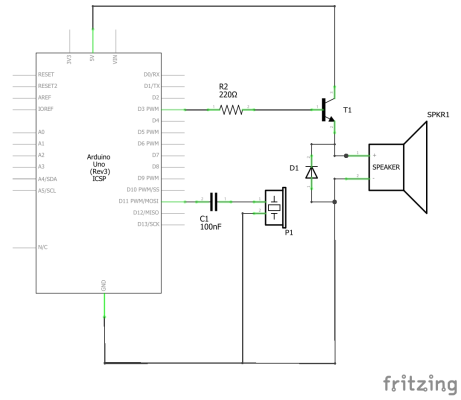
A piezo sounder can be connected to a microcontroller pin via a small capacitor.
Otherwise, a speaker or headphone earpiece can be connected via a transistor.
To debug your code, you will need to attach a piezo sounder to the PWM pin, or you can use a transistor to boost the output to drive a loudspeaker or headphone earpiece. By adding a line of code to change frequency at strategic points where you think there is an issue, your code will create a melody as it executes. Passing through different sections of the code changes the ‘music,’ and you’ll learn what sounds right and wrong with time. For those who are old enough, it may remind you of the old modems we used to access the Internet before the age of DSL!
Keeping Time
With some microcontrollers, it is easy to determine how long a code section should take to execute. For example, most of the assembler instructions of a PIC10/12 require just one clock cycle, except for instructions that change the program counter. With this knowledge, you can calculate how long a code section should take to execute under your test condition and compare it with an oscilloscope or logic analyzer.
The hardware setup for this approach is the same as for the LED, but the LED is not needed. The only difference is the preparation required to determine code execution time.
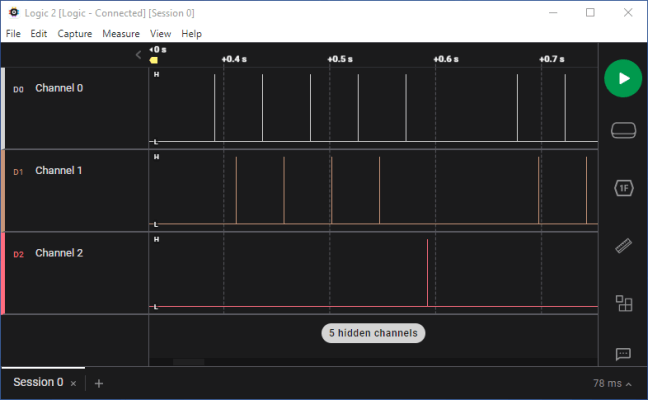
Toggling pins in sections of code can be captured using a logic analyzer
to trace the code execution path.
If you’re not keen on decoding assembler, you can measure code execution time between different points instead. By exercising different paths through your code, you should get a feel for what might be going wrong. For example, if a for or while loop is exceptionally long or short, it may be that a variable is incorrectly initialized or that a decision that should end a loop is wrongly coded.
Outputting Messages
Should your microcontroller be advanced enough, it may have a serial interface, such as a U(S)ART or SPI. Like the PWM, these are also set up and forget peripherals. To avoid the need to buffer data, the interface should be configured to operate at its highest frequency, even if it is a quirky, non-standard baud or signaling rate. The reason that it doesn’t matter is that we won’t be connecting it to another device. Instead, we’ll simply be using a logic analyzer.
USB-based logic analyzers are really cheap nowadays, and the software provided can be configured to decode serial data. If you don’t have one to hand, you could even build your own to support this debugging approach using an Arduino with a fast, powerful Arm processor.
These interfaces typically only require a byte of data to be written to a transmit register, again something that is typically implemented in a single clock cycle. After that, the bits are shifted out as per the configured data rate. All that is left to do is assign different values to be written at different points in your code. As the data is streamed out, you acquire a trace of the execution path of your code. Provided the interface is fast enough, no data should be lost.
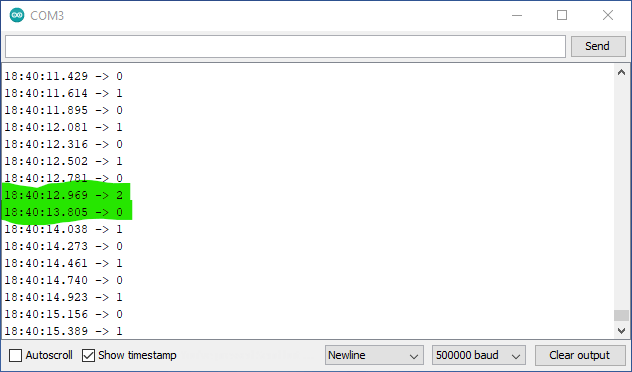
The Arduino IDE's Serial Monitor can also timestamp messages received, which can help determine unexpectedly long sections of code execution. However, the resolution of the timer used may not be enough to resolve short sections of code exection.
Arduino's Serial Monitor can timestamp messages. Here we see an extended period
between '2' and '0' that may indicate a code execution problem.
This approach could also be used to output values stored in variables or registers, although the output could quickly become confusing to decode due to the limited information.
No Debugger? There’s Always a Way
Just because you don’t have a debugger doesn’t mean you can’t debug your code. You just need to apply a little lateral thinking. The methods described here, coupled with an understanding of your code and the microcontroller being used, can help resolve a wide range of issues. They can even help when a debugger cannot! And, if none of the above are open for you, perhaps you’ll find another peripheral or feature that can be repurposed to act as a debugging support tool.
Elektor Magazine has been one of the leading sources of information on electronics for engineers, designers, start-ups and companies for 65 years. Our magazine is powered by an active community of electronics engineers – from students to professionals – who are passionate about designing and sharing innovative ideas.
For them, we publish hundreds of items a year, in formats such as articles, videos, webinars, and other learning formats. Our mission is to share knowledge in every possible way and inspire readers with the latest developments within the electrical engineering sector.
Thank you for your vote!
Leave further comments in the fields below.
Thank you for your vote!
If you wish to leave a comment with your rating, please first use the login below. If not, just close this window.

Discussion (8 comments)