
The Full Gamut of Microcontroller Debugging Techniques
June 30, 2020
on
on
 The microcontroller (MCU) is a brilliant invention, but it can be truly frustrating when it doesn’t function as expected. You can trace most issues back to one of two things: a failure to understand a specific MCU feature, or a mistake in the code. It is in such situations that the ability to "look inside" the device would be very helpful. Today’s MCUs typically offer integrated debugging interfaces that allow them to be programmed (flashed) and debugged, with basic debug hardware fitted to low-cost development boards. However, this is not always the case and, sometimes, a lot more is on offer. Here we take a look at some of the ways code can be debugged and what it involves. Let's brush up on microcontroller debugging techniques.
Flash an LED; Toggle a Pin
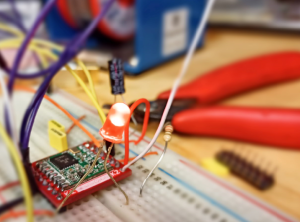
To determine if a software or interrupt routine is being called at all, it can help to insert some extra code that turns on an LED. This will clarify if the code is being reached at all. Turning the LED on and off at specific points in the code can also help. However, this quickly loses its effectiveness when used in several places as it can become unclear which section of code changed the state of the LED.pinMode(LED_BUILTIN, OUTPUT);
digitalWrite(LED_BUILTIN, HIGH);
…
digitalWrite(LED_BUILTIN, LOW);
digitalWrite(LED_BUILTIN, HIGH);
…
digitalWrite(LED_BUILTIN, LOW);
Code example 1: The standard LED on Arduino boards can be controlled using the digitalWrite and pinMode functions.
Code can also execute so quickly that the turning on and off of the LED cannot be seen anymore. Should you have an oscilloscope or logic analyzer to hand, the alternative is to simply toggle a free general-purpose input/output (GPIO) pin. Pins can also be dedicated to specific sections of the code or interrupt routines.
Some problems are linked to timing issues and the simple insertion of some extra pin-toggling code can be enough to resolve, but not understand, the problem. If possible, keep such extra code short by using inline assembler, such as a single instruction bit-toggle.
__asm__ volatile ("btg latb, #0");
Code Example 2: A pin can be toggled in a single cycle bit-toggle instruction with inline assembler using the XC16 compiler on Microchip Technology’s PIC24/dsPIC.
Serial Output
By far the most comfortable method to output code status updates is using the serial interface, commonly known as the UART. The well-known printf() function can be linked to an available UART interface, but the code behind this function is quite processor intensive, especially when data values need to be formatted into the output string.The implementation of the Arduino Serial library is a good compromise between string formatting and processor load. It quickly copies the desired text or numerical values into a buffer in SRAM, using UART interrupts to transfer the data across to the developer’s PC. It’s not as fast as toggling GPIOs and will, therefore, have some impact on code execution time. However, the higher level of verbosity it offers can deliver more clarity on the issue being investigated, especially when a variable or register contents are output.
Serial.begin(115200);
…
Serial.println(“Button pressed...”);
…
Serial.println(“Value: ”);
Serial.write(dataByte);
…
Serial.println(“Button pressed...”);
…
Serial.println(“Value: ”);
Serial.write(dataByte);
Code Example 3: Text strings provide more insight into code execution, made possible with the Serial library on Arduino boards.
Debugging Interfaces
Most modern MCUs feature an on-chip debug module. This opens up access to all the internal circuitry, including memory, CPU registers, and all of the peripherals. Also, it can be used to start and stop code execution or reset the device. The development software on the PC can also be used to set ‘breakpoints’, marking a specific line of code with a flag for the debugger. When this line of code is reached, execution halts and the status of all memory and registers are retained. From here, the developer can check to see if all the variable and settings match with their expectations.Much code executes without generating any stimulus that can be measured outside of the MCU. For example, you may be unsure if a timer interrupt routine is being called at all. Creating a variable and incrementing its value in this code can be a good way of checking how often, if at all, the code is executed. The variable’s content can be checked when a breakpoint is reached or the MCU is halted. Such code should have minimal impact on code execution, typically reducing to a simple increment instruction in assembler. To make this work, the count variable should be defined as volatile, as compilers tend to optimize away variables that have no clear purpose, especially in interrupt routines.
volatile unsigned int counter = 0;
…
ISR(TIMER0_OVF_vect) {
counter ++;
…
}
…
ISR(TIMER0_OVF_vect) {
counter ++;
…
}
Code Example 4: Creating a variable that counts up in an interrupt routine on an AVR MCU.
Tracing Code
The most advanced debugging capability on offer is known as trace. A simple explanation is that it uses a combination of the debug interface and possibly other dedicated pins to output all the instructions executed to the development software. There are, however, many variations to this available. The output allows the developer to trace the precise flow the processor took through the code, including interrupts, and in what order functions were called. The Infineon Aurora interface on Aurix MCUs can transfer this information out at gigabit speeds.If full hardware trace is unavailable, instrumented trace may be available. This is similar in principle to outputting text strings via the UART but can have as little as zero impact on execution time. Some Microchip MCUs, together with MPLAB X, support this feature, making use of the debug interfaces or SPI to transfer the trace messages.
TRACE(id);
LOG(id, variable);
LOG(id, variable);
Code Example 5: MPLAB X supports instrumented trace and the logging of variable and register values.
Microcontroller Debugging Simplified
Determining why code doesn’t run as expected on an MCU can be highly rewarding. However, the methods used in this process mustn't impact the code to such a degree that the issue magically "goes away." Advanced MCUs with on-chip debugging hardware provide the most insight into what is actually going on but often require significant financial investment and time to learn how the features work. For the cash-strapped, a simple GPIO pin and an LED can be very effective for resolving most issues.Read full article
Hide full article
Discussion (0 comments)