
Build an Energy Logger to Measure and Record Power Consumption
on
There are many potential applications where a continuous record of the generation or consumption of electrical energy makes sense. Just think of the energy consumption of certain circuits in the house or the energy supplied by a balcony power plant or a larger photovoltaic system. There are ready-made solutions for recording, but you can also build a suitable logger yourself.
The logger presented here uses a meter with an S0 output to record electrical power consumption. Suitable meters are available for less than €20 (e.g., at Amazon, eBay or directly from the Far East). This allows the energy consumption of connected mains power circuits or also the yield of photovoltaic systems to be measured and “logged” or recorded using the electronics described here.
Editor's Pick: Check out Dr. Thomas Scherer's article, "DIY Solar PV Installation: Building a Balcony Power Plant."
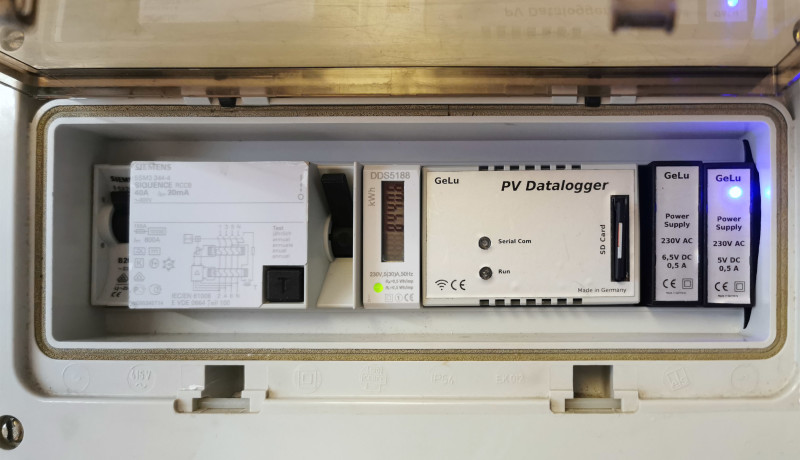
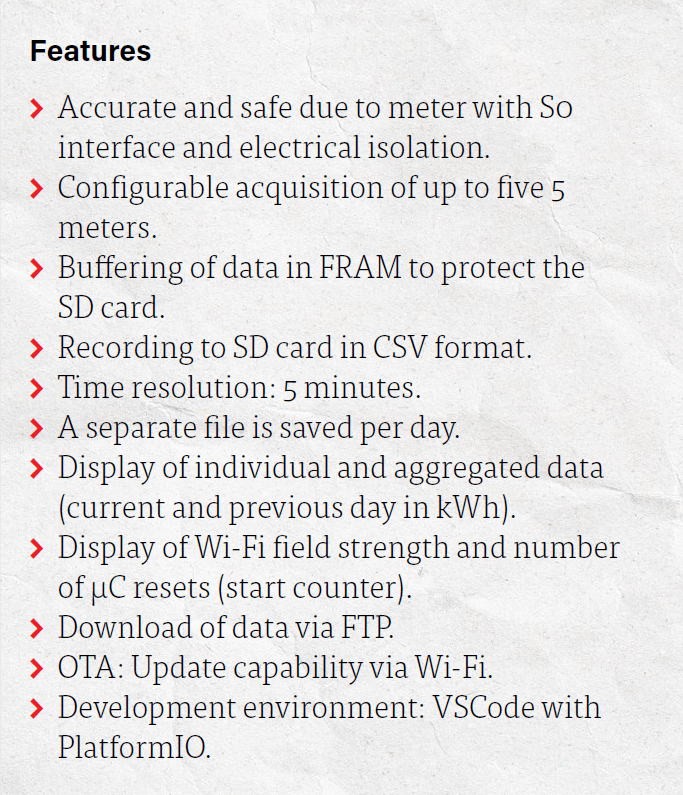
After all, what was it that microcontrollers were invented for? Pretty much for this kind of application. Before the computer age, recording energy consumption or generation over time would have been difficult and virtually impossible for home use. Thanks to inexpensive microcontrollers with all their great capabilities, not only is digital logging no problem today, but even fancy things like a Wi-Fi connection and more become possible. What the energy logger can do can be found in the Features box. An impression of the finished solution is given in Figure 1, showing the combination of meter and logger, including power supply units, installed in a plastic distributor box.
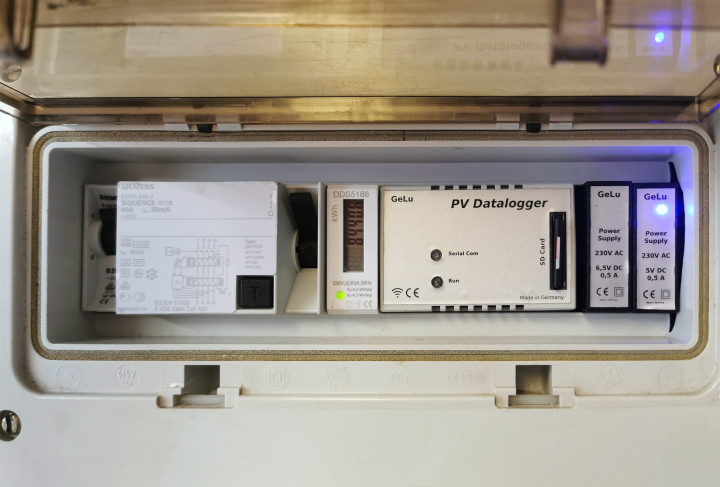
installed in a small plastic distributor.
Energy Logger Circuit
Thanks to the microcontroller, the circuit of the energy logger (Figure 2) is quite simple. On the left side, there are a number of optocouplers for electrical isolation, through which the data from the meter’s S0 interface are sent to the corresponding inputs of the microcontroller. These are interrupt-controlled to make sure that no pulse is lost. I used an inexpensive ESP32 module because it has enough computing power and also a Wi-Fi interface. On the right side, there are two memory modules — a slot for an SD card for mass storage and an additional FRAM module, which temporarily buffers the data of 5 minutes in order to reduce the number of write cycles to the SD card.
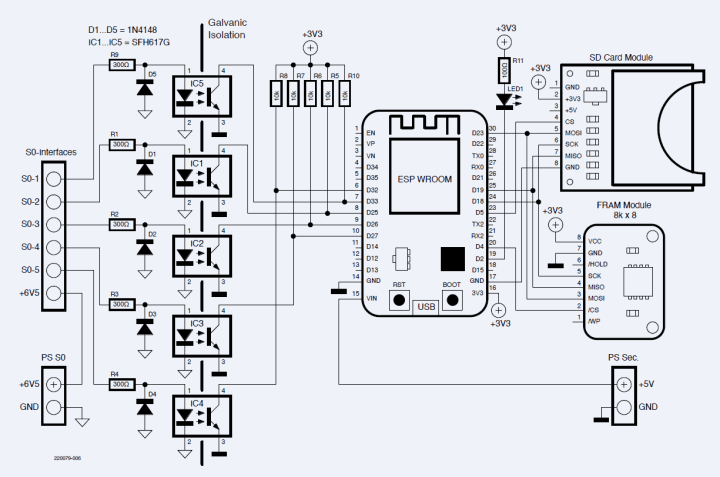
Since the circuit is so simple, I built it on a breadboard. As you can see from the two light blue blocks, two separate power supplies are provided for safety reasons. For the S0 interfaces on the left, 6.5 V is sufficient. The rest of the circuit is powered by a 5 V power supply (right). A load capacity of 0.5 A each is sufficient. For the purpose of electrical isolation, the two GND lines of the power supplies must not be connected under any circumstances. Furthermore, below the optocouplers — between their inputs and outputs — all copper must be removed over a distance of at least 4 mm. Figure 3 shows how this is supposed to look. The electrical isolation by means of two separate power supplies also allows that the ESP32 to be connected to the USB interface of a PC (e.g., to allow future updates to be sent to the installed controller). Instead of using two power supplies, a solution with only one power supply with a higher current load plus an isolating DC/DC converter and a voltage regulator would also have been possible, but this would not really make things easier nor cheaper.
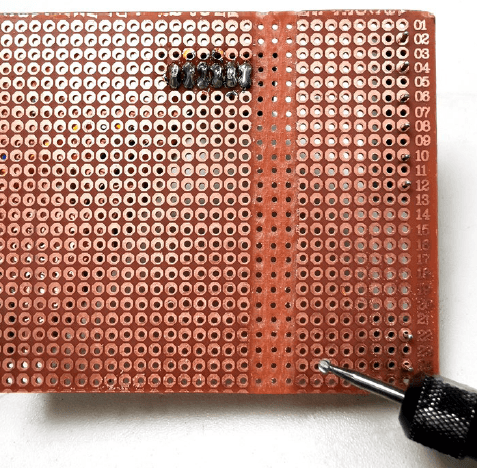
outputs of the optocouplers was removed with a small cutter.
Data Storage and Transmission
As already mentioned, using two memory modules is not a luxury. The S0 interfaces can sometimes deliver several pulses per second. If the measured values were collected in the internal memory of the microcontroller, data could be lost during a reset. On the other hand, writing them immediately to an SD card would massively shorten the card’s service life. With only one value per second, 31.5 million write cycles would occur per year. However, the memory cells of an SD card reach the end of their life after only 1,000 to 3,000 write cycles. Even a high-capacity card would therefore almost certainly show defects before a year has passed.
To avoid this, a stable buffer is provided. The external FRAM module used here has a storage capacity of just 8 kB, but that is easily enough to collect quite a few values. The biggest advantage of FRAM is that it can be written to at least 1010 times, depending on the manufacturer — typically, such a memory can even withstand quadrillions of write cycles. Every five minutes, the data collected in FRAM is transferred to the SD card. This means just over 100,000 write operations per year, and since an SD card has many memory cells, it can be operated for quite a few years without any problems.
In addition, the number of restarts of the logger is recorded to the FRAM, allowing you to check at any time how often a reset was triggered. Furthermore, a new file is created on the SD every day, and the data of this day is saved to it. In order to save memory space, the recording is only started if one of the meter values has changed since midnight. If the energy logger is used to record power consumption, this feature is actually superfluous. However, if the energy production of a solar system is monitored, it is useful that the recording only starts after sunrise (i.e., when the first electricity is generated).
Data Structure and More
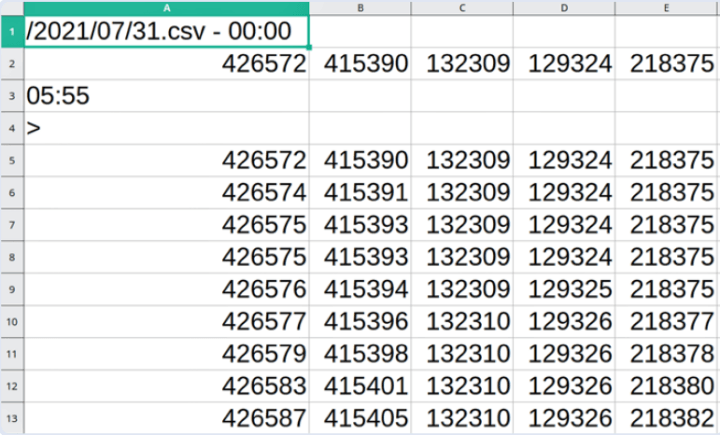
Figure 4 shows a section of a spreadsheet where the data has been imported in CSV format. Cell A1 contains the date and time the file was created. Row 2 then contains the last values of the previous day as the new starting point. The first change of a meter value occurred at 05:55 (cell A3). From row 5 on, the new data of this day follows. The columns contain the data of the individual meters. Each row has a time difference of five minutes to the next row. The data is recorded on each day until midnight. Every day, a new file is created. The amount of energy can then be calculated from the difference between the counted values using the pulse value of the meters (e.g., 0.5 Wh/pulse). The CSV format is economical and suitable for importing into any spreadsheet like Excel, OpenOffice/LibreOffice Calc or Numbers on the Mac. The data can then be further processed to your liking.
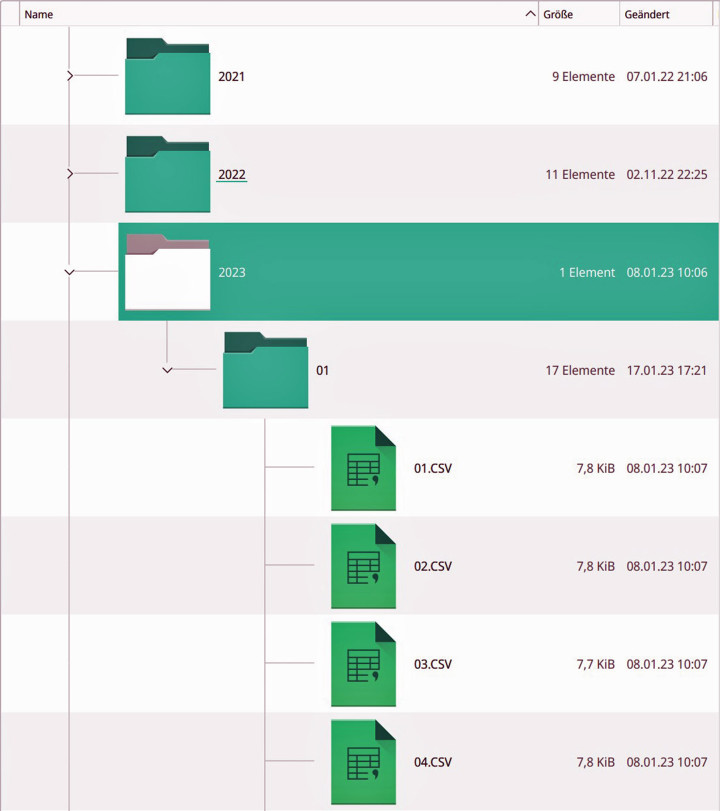
On the SD card, the data is stored in a temporal folder structure. At the top level, there are folders for each year, each of which contains subfolders for the months, and these then contain the files for the individual days. Figure 5 shows the structure. In this example, the values of five meters are recorded as integers (see Figure 4). Thanks to the CSV format, relatively little memory is required for this. This results in a few kilobytes per meter per day. The transfer of data from the logger to a PC is done via FTP. Common FTP clients such as FileZilla are suitable for this. Since the logger is integrated into the home network via Wi-Fi, this method is probably the simplest.
I created the source code for the ESP32 using the PlatformIO IDE for VSCode. The code is available for free download on the web page of this article.
The following data must be customized in the main.cpp file: Starting at line 30, the SSID and the password of the Wi-Fi network must be entered. The username and password for FTP are specified in line 813. By default, “esp32” is entered as the username and password. Of course, the FTP client also needs the IP address of the energy logger. This address is output via the USB interface after a reset. Ideally, however, you should configure your router so that the energy logger is always assigned the same IP address.
Built-In Web Interface
The current data and the total value of the day and the previous day are displayed using the integrated web server. The server hosts two pages. One page shows the current power per meter as well as the total of all connected meters. In addition, the total energy of the day and the previous day is displayed in kWh. The other page shows the field strength of the Wi-Fi network and the number of restarts of the logger.
Figures 6 and 7 are screenshots from a smartphone. As you will notice immediately, I do not use the energy logger to measure consumption, but to monitor my photovoltaic system, which has five inverters. Therefore, I have adapted the labels of the individual values to my intended use. But you can easily change this in the software as needed. When connecting to the IP address in the browser, you get the display of Figure 6. By appending “/about” to the address or by clicking on the Info button, Figure 7 appears.
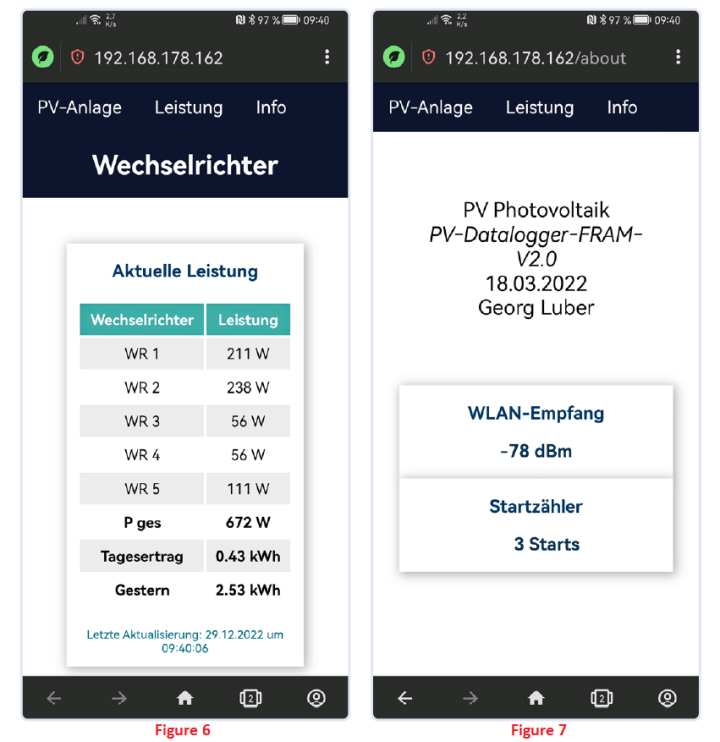
“/about” to the IP address or click on Info, you will get this info.
One more note about the Wi-Fi connection: If you install the energy logger in a metal housing, you will almost certainly get reception problems.
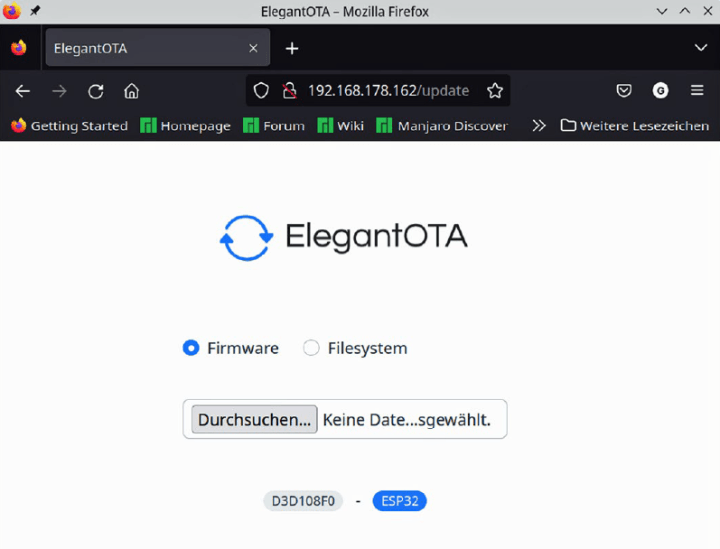
OTA
Once the energy logger is built into a housing and installed, you will probably not want to remove the electronics again in case of a software change. Therefore, the data logger can be updated “Over The Air” (i.e., via Wi-Fi). The complete software as well as the file system — the web pages with JavaScript and the CSS file — can thus be reloaded if necessary. If you want to do that, you enter the IP address with appended “/update”. Figure 8 shows how this looks like in my case. I implemented the OTA capability with the help of Ayush Sharma’s library.
A Simple Circuit
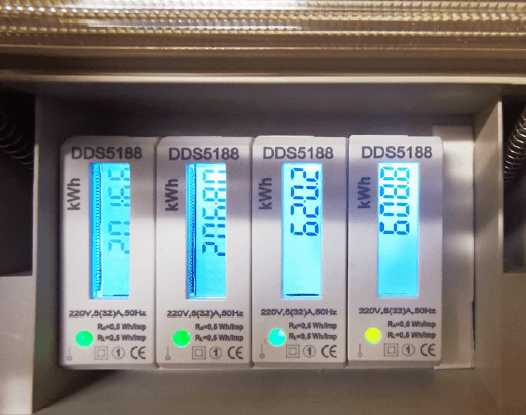
The circuit is so simple that a parts list is actually unnecessary. Besides the ESP32 development board, which is available everywhere, important components are an SD card slot, which is available on inexpensive breakout boards, and the FRAM module — also conveniently available on breakout boards. Since breakout boards are available with different pin assignments, you should not pay attention to the pin numbers, but to the pin designations when connecting. For the SD card module, MOSI may be connected to DI or SI and MISO to DO or SO. The meters can be any inexpensive model for DIN rail mounting with an S0 interface. The DDS5188 type I used (Figure 9) is easily available and very inexpensive.
While it should go without saying that you must exercise the necessary care when working with mains power, a note should be allowed: Different national laws apply to work on the fuse box. In Germany, you must be registered with the network operator as a trained electrician for this purpose. Also, work on external sub-distributors connected to the fuse box is only allowed for a skilled electrician with the appropriate training and knowledge.
Editor's note: Article 220079-01 (Translated by J. Starkmuth) appears in Elektor May/June 2023. Do you have questions or comments about this article? Contact Elektor at editor@elektor.com.
About the Author
Georg Luber is a trained electrician who studied electrical engineering and worked for many years in the fields of electrical safety and electrical installation. He has worked nationally and internationally in standardization committees (DKE/VDE, CENELEC, IEC and ISO). Another focus of his work was building automation, particularly KNX. Georg Luber is involved in the development of software and electronics projects in these areas.
Discussion (3 comments)