
Book Review: THE LTSPICE IV SIMULATOR ups your simulation skills
Graphs & traces
Circuit simulation output is usually most conveniently displayed in the shape of graphs and LTspice has plenty of them. Chapter 8 is dedicated to graphs or the “virtual oscilloscope” as it is called in the book. In about 50 pages the ins and outs of traces are detailed. Did you know that clicking on a part while pressing the ALT key will show the instantaneous power the component is dissipating? Or that clicking the label of a trace with the CTRL key pressed allows you to visualise the average (RMS) value of that trace over a time period?Running simulations
Chapters 9 and 10 cover circuit simulation, from DC and AC analysis to temperature sweeping, noise models and non-linear simulations. The book treats time- and frequency domain analysis as well as component value tolerance distributions with Monte-Carlo simulations. Chapter 11 adds numerical measurement commands, and shows how to repeat simulations with different component values.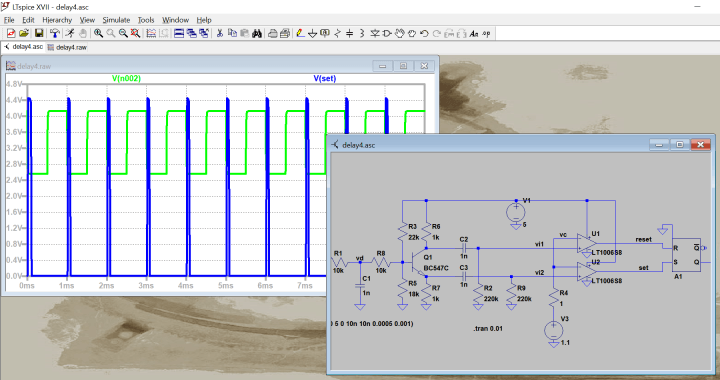
"She’s a model and she’s looking good"
Simulations can only be as good as the underlying component- and signal models allow it to be. This is why chapters 12 through 17 deal with models and modelling. Voltage and current sources are the subject of the 60 pages of Chapter 13. The two main types — dependent and independent sources — are described in detail, but unfortunately the title of section 13.10 incorrectly refers to independent sources. A tad sloppy :-(Passive components are explained in Chapter 14, while Chapter 15 gets busy with semiconductor models (special mention for the VBIC bipolar transistor model with its 108 parameters…).
Parts that you often need but never really know how to use — switches, transmission lines, digital logic, etc. — are described in Chapter 16.
Read full article
Hide full article
Discussion (3 comments)