Tracking Down Microcontroller Buffer Overflows with 0xDEADBEEF
Software development on microcontrollers can be a real challenge at times. Sometimes the code just doesn't function as planned, but you can't really figure out why. In such cases, it is time to approach the challenge like Columbo, Jessica Fletcher, or (insert your super sleuth here), do some investigative research, and find out who the culprit is! And for that, you may need to lay a trap using dead beef (0xDEADBEEF).
Software development on microcontrollers can be a real challenge at times. Sometimes the code just doesn't function as planned, but you can't really figure out why. In such cases, it is time to approach the challenge like Columbo, Jessica Fletcher, or (insert your super sleuth here), do some investigative research, and find out who the culprit is! And for that, you may need to lay a trap using dead beef (0xDEADBEEF).
Code sometimes stops working as expected for seemingly no rhyme or reason. Perhaps some data changes unexpectedly, the program just seems to "stop," or the microcontroller resets unexpectedly. The first thing to do is to admit that there is most likely a programming problem. Microcontrollers only do what we tell them to do, so we must have, inadvertently, put it in a position to do the unexpected. Such issues may also arise because we do not fully understand how the compiler and linker functions.
Make the Error Reoccur
The first step in your investigation, if the error is sporadic, should be to determine how to make the error reoccur. By invoking the error repeatedly, you are then able to undertake further tests to see whether you can make it "go away." However, you need to make sure the cause is clear so that you can be sure that whatever you changed actually resolved the error and didn't just shift the problem elsewhere!
It is tempting to add extra "test code" and variables to help in this process. If such a change makes the error "disappear," it could be that a memory problem is the cause of the issue. These can be the result of buffer overflows or an overflow of the stack.
Buffers are typically implemented as arrays on microcontrollers in C and will be defined with a fixed length. Less used on microcontrollers, but also possible, is an array that is allocated at run-time using "alloc" (such as malloc or calloc). These are known as dynamically allocated arrays. Either way, the C language makes it very easy for programmers to write code that accesses memory beyond the defined bounds of an array. The result: writing to an array could accidentally overwrite neighboring variables.
Subscribe
Tag alert: Subscribe to the tag Microcontroller and you will receive an e-mail as soon as a new item about it is published on our website!
Laying a Trap with Dead Beef
One way of checking whether arrays are being written beyond their bounds is to fill them with a known pattern before they are used. Because hexadecimal includes the letters A to F, simple words can be formed that provide easy to recognize patterns. One of these is 0xDEADBEEF.
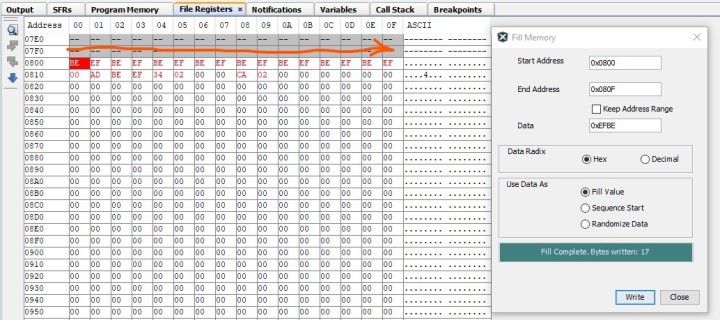
One way to do this is through the IDE and debugger being used to develop the code for your microcontroller. The first step is to determine the start and end address of the array. Then, using a view of the memory (RAM), it is usually possible to write such a pattern from the start address to the end address.
The development environment (here MPLAB X IDE) can be used to fill a section of RAM with a pattern.
The best approach to this debugging method is to download the code to the microcontroller and allow the code to run until main() has been reached (set a breakpoint at main() or use "run to cursor"). Determine the start/end address of your array, write the pattern, and then allow the code to execute for a while. Pause code execution and then check the memory location you filled with your 0xDEADBEEF pattern. If none of the pattern can be found, this may be because data has been written beyond the end of the array at some point. All that is left is to determine when and why.
Note: Your development environment (IDE) may not allow the full 0xDEADBEEF pattern to be written. In the example above, MPLAB X only allows a 16-bit pattern to be written into the memory of the PIC24F, which is a 16-bit microcontroller. Here we chose to just use 0xBEEF, which is also recognizable. Alternatively, you may be able to write your pattern into an ASCII file, save it to your hard drive, and then load this into memory.
Did My Memory Change?
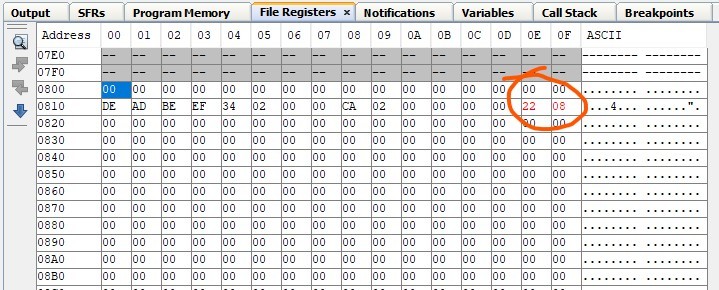
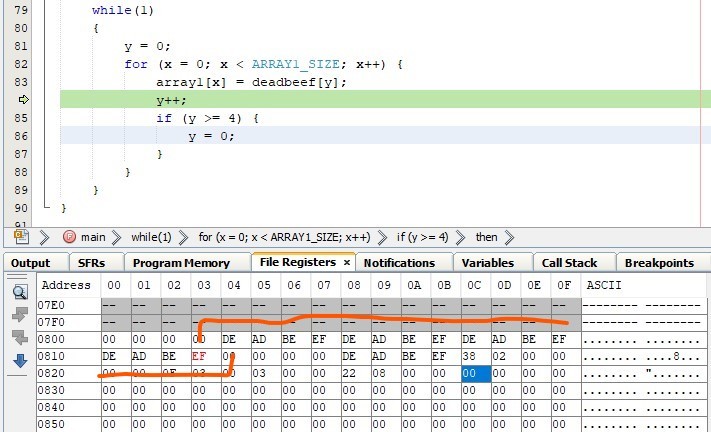
Another helpful feature of most debuggers in such investigations is that they highlight memory locations that have changed in a specific color, such as red, when the microcontroller is halted. If you halt code execution with the memory region you are examining in view, any bytes that have changed in value in the meantime will be shown in this different color.
Since the MCU was last halted the memory location circled in orange has changed, as its contents are highlighted in red. Black values denote no change. If you weren't expecting these values to change, you may be on your way to finding your software bug.
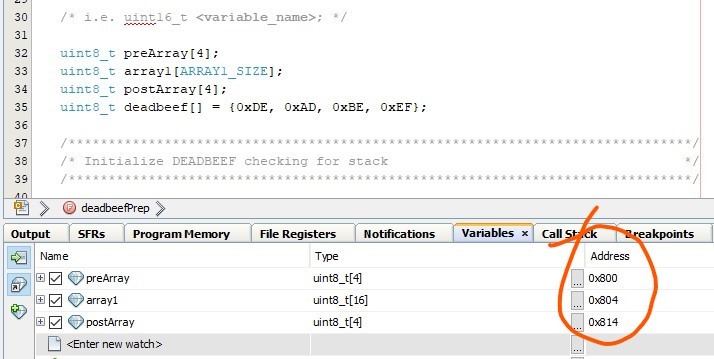
If your 0xDEADBEEF pattern is completely gone, it will be difficult to know how far the erroneous code has been written beyond the bounds of the array. In such cases, try defining additional arrays as a "buffer" before and after the array being examined. This a little tricky in C/C++ as, without some extra code, you cannot define the address to which variables are allocated. However, generally speaking, variables defined after one another in code appear after one another in memory too. This means that if you declare some 'extra buffer' arrays, one before and one after the array you are investigating, you'll probably find they are allocated directly before and after that array in memory. Simply fill all arrays with 0xDEADBEEF, execute the code, and check to see if the pattern in both is intact.
Two extra arrays defined to help debugging are, luckily, located at addresses before and after the array we are investigating. The linker can also be forced to use specific addresses if this is not the case.
Debugging Real-Time Code
Many real-time applications, such as those controlling motors, or implementing interfaces like USB or Ethernet, cannot be stopped and debugged line by line as this would stop them working completely. This means that we cannot stop the code to write the 0xDEADBEEF pattern into memory using the IDE. Instead we need to do this software. This is simple to implement using a short array that is pre-filled with 0xDEADBEEF and a bit of code that copies it into the array(s) your are investigating.
/* Example code that writes 0xDEADBEEF pattern into an array on a Microchip PIC24F microcontroller */
#define ARRAY1_SIZE 16
uint8_t deadbeef[] = {0xDE, 0xAD, 0xBE, 0xEF};
uint8_t array1[ARRAY1_SIZE];
int16_t main() {
uint8_t x = 0;
uint8_t y = 0;
while(1)
{
y = 0;
for (x = 0; x < ARRAY1_SIZE; x++) {
array1[x] = deadbeef[y];
y++;
if (y >= 4) {
y = 0;
}
}
}
}
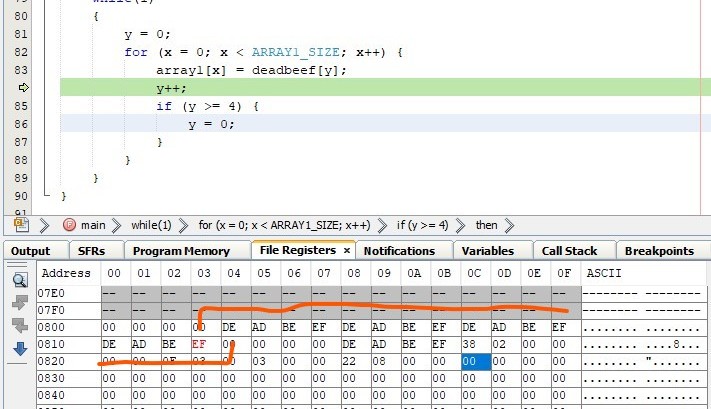
The code can be allowed to execute in its entirety until it either stops due to the error or the microcontroller is halted by the developer. When this occurs, the memory can be analysed using the IDE. Even if the error caused the microcontroller to reset this does not clear the memory (unless some start-up code clears it all to zero) as long as it remains powered on. This means the debugger can still access the RAM in the state it was in before the reset and you can search for any buffer overruns that have overwritten your 0xDEADBEEF patterns.
The example code has written the 0xDEADBEEF pattern into the target array (marked in orange).
Filling with 0xDEADBEEF Before main()
Another possible issue is that the stack is being written beyond its limits. Many microcontrollers have hardware detection for stack overruns. However, such a feature may not be available, or you may have defined the use of RAM differently. The stack can, of course, be filled using the IDE as already mentioned. However, you may need to fill this space with your 0xDEADBEEF pattern before your code executes (i.e., before main() is reached).
Microcontrollers have quite a bit to do before main(), more than we have time to cover here, but they include some hooks allowing user code to be executed before the CPU jumps to main(). This capability can be used to fill the stack with 0xDEADBEEF.
The method for doing this varies from microcontroller to microcontroller, but can be broken down into the following steps:
Determine the start of the stack.
Determine the end of the stack.
Fill this region with 0xDEADBEEF.
The following example, written in C, is for a Microchip PIC24F 16-bit microcontroller, implementing the user_init function (search the compiler documentation for more details) that will be called once the device is initialized but prior to main().
// Find out where stack is pointing now from SP (WREG15)
stackPointer = (uint8_t*) WREG15;
// Increment to next memory position after current stack pointer location
// (we have a byte pointer into word-addressable memory)
stackPointer += 2;
// Loop through stack area until we reach stack limit address (in SPLIM register)
for (y = 0; stackPointer < (uint8_t*) SPLIM; ++stackPointer) {
// Write part of 'DE AD BE EF' into stack
*stackPointer = deadbeef[y];
// Cycle through four bytes of DE AD BE EF array
++y;
if (y >= 4) {
y = 0;
}
}
}
Knowing that the stack pointer is stored in a specific register, in this case WREG15, the address to which it is pointing is stored in a pointer variable. In this architecture, this is pointing to the current return address for the function currently being executed, so we need to avoid overwriting it. Therefore, we increment the pointer by two bytes (this is a 16-bit device) so we can start writing the 0xDEADBEEF pattern from the next word-addressable location in memory. The remainder of the code writes the pattern, stopping when the end of the stack is reached. This limit is determined by using the content of the stack limit register SPLIM (another a register unique to this processor architecture).
This approach can be adapted for most other microcontrollers quite easily, but will probably require some in-depth reading of the documentation for the chip and the compiler tool chain.
The Optimal Approach to Discovering Buffer and Stack Overflows
Probably the most important thing to remember is that, if the code on a microcontroller doesn't work as expected, it is probably because of a programming error. Try to determine what causes the problem so that it can easily replicated. From this point, it will then be easier to determine which code changes you have made are resolving the issue and what the ultimate cause may be. If buffer or stack overflows are suspected, try to 0xDEADBEEF them using one of the approaches discussed here.
Subscribe
Tag alert: Subscribe to the tag Embedded & AI and you will receive an e-mail as soon as a new item about it is published on our website!


Discussion (0 comments)